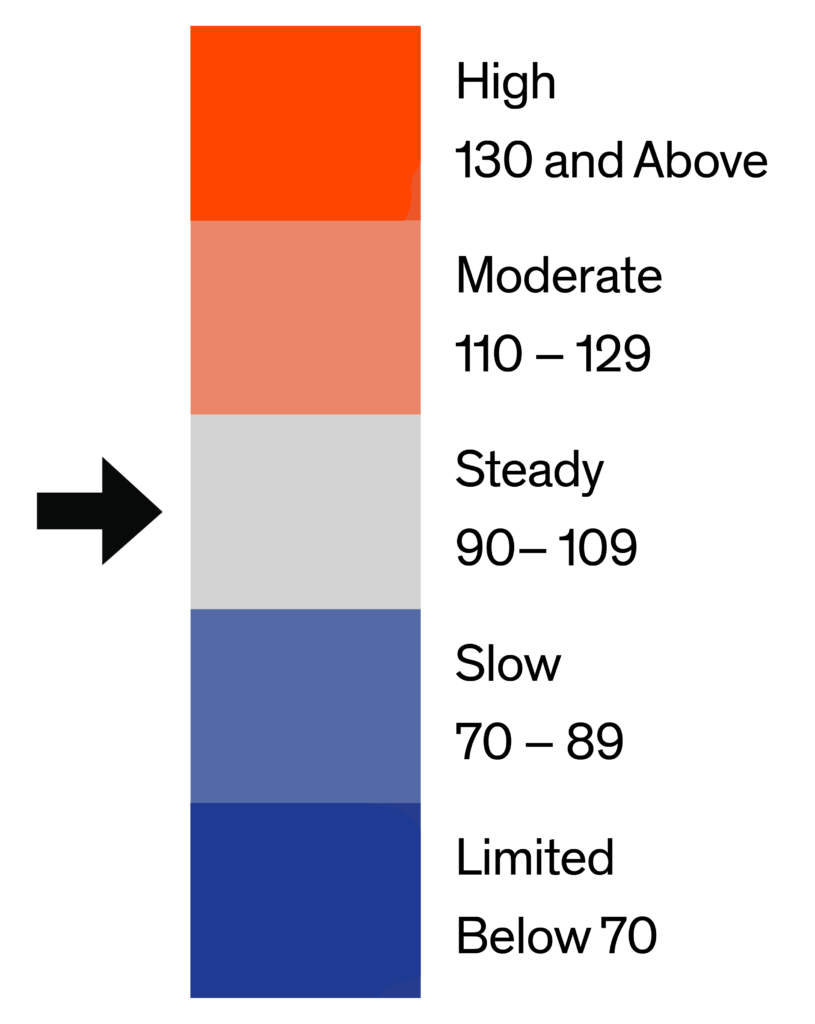
The Bright MLS | T3 Home Demand Index for the Baltimore MLS market area rose a modest nine percent in January to a reading of 95, reflecting buyer demand in the Steady category. While the Index rose over the month, it was nearly 13 percent lower than one year earlier.
While the overall level of demand for residential real estate in the Baltimore market area was Steady in January, buyer interest varied among the types of homes tracked by the Bright MLS | T3 Home Demand Index. Lower-priced single-family demand was the weakest, a pattern that has been a consistent characteristic of the local market for several months. In contrast, demand was significantly stronger in the higher-priced single-family and condo segments. Challenging inventory conditions were present among all market segments ranging from a low of one month for mid-priced single-family homes to 3.6 months for higher-priced condos. Compared to the previous month, buyers searching for a home found little relief with months supply up only slightly in January.
Monthly Statistics for February 2021
Home Demand Index
95
(Steady)
Home Demand Index from prior month
87
Home Demand Index from prior year
109
Index change from prior month
9.2%
Index change from same time last year
-12.8%
Bright MLS | T3 Home Demand Index
www.homedemandindex.com
Download tile as an image.
Embed this tile on your site.
Baltimore | February 2021
Home Demand Index | Historical Year-over-Year Comparison
During the second half of 2020 the Bright MLS |T3 Home Demand Index was significantly higher than the level one year earlier. This elevated demand can be attributed to several factors including low mortgage interest rates leading buyers to intensify their search for a home even as inventory levels among most segments of the market remained low. In January, the Index rose nine percent following two months of decline as would-be buyers started searching for homes in anticipation of the spring buying season. While still early, the January data indicate that buyer demand was off to a slower start than one year ago.
Home Demand Index
Bright MLS | T3 Home Demand Index
www.homedemandindex.com
Download the top-level Market Areas map as a screenshot.
Embed this tile on your site.
Baltimore | February 2021
Home Demand Map
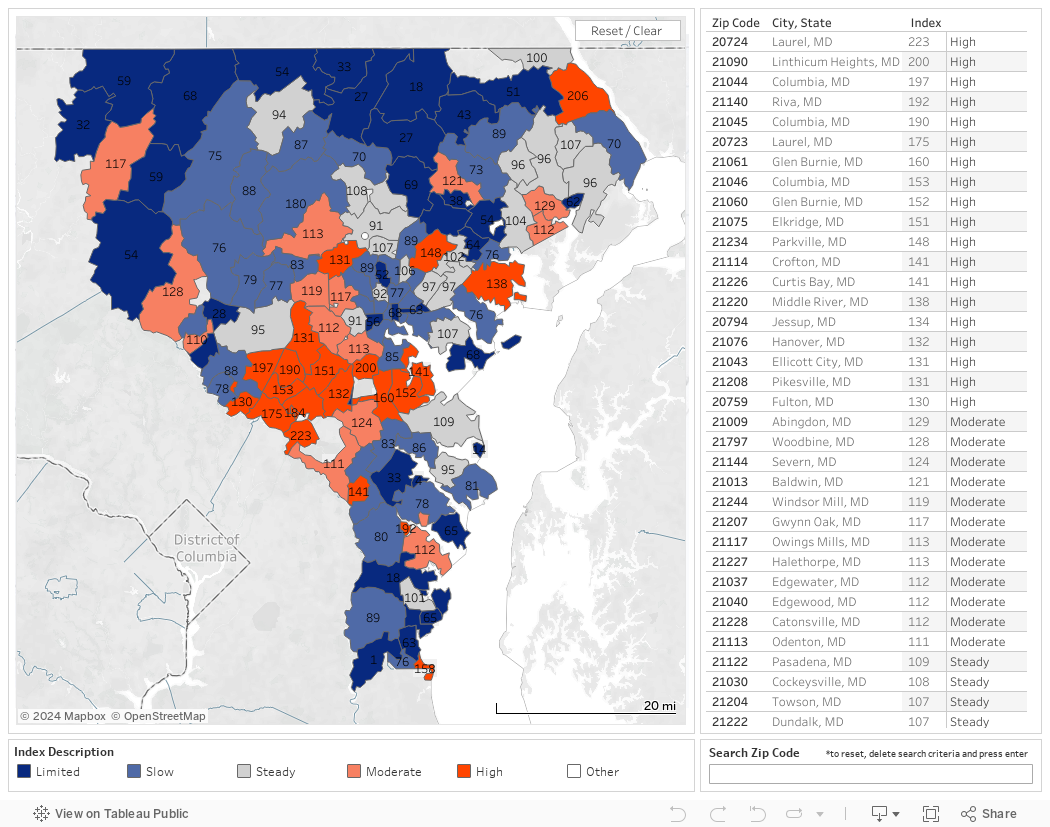
Within the Baltimore market area, roughly one-quarter of ZIP codes recorded a High or Moderate level of buyer demand. This share was modestly higher than last month as more submarkets recorded increased buyer interest. Demand in more than half of ZIP codes was in the Slow or Limited category, mostly in areas surrounding the urban core and close-in suburban areas.
Bright MLS | T3 Home Demand Index
www.homedemandindex.com
Download tile as an image.
Embed this tile on your site.
Baltimore | February 2021
Demand and Inventory by Home Type
While the overall level of demand for residential real estate in the Baltimore market area was Steady in January, buyer interest varied among the types of homes tracked by the Bright MLS | T3 Home Demand Index. Lower-priced single-family demand was the weakest, a pattern that has been a consistent characteristic of the local market for several months. In contrast, demand was significantly stronger in the higher-priced single-family and condo segments. Challenging inventory conditions were present among all market segments ranging from a low of one month for mid-priced single-family homes to 3.6 months for higher-priced condos. Compared to the previous month, buyers searching for a home found little relief with months supply up only slightly in January.
Bright MLS | T3 Home Demand Index
www.homedemandindex.com
Download tile as an image.
Baltimore | February 2021
Single Family Home Below $250k
Buyer demand for single-family homes priced below $250,000 has been weak for several months. The latest data reflect a continuation of this trend with the Index in the Limited category in January. While the Index was unchanged over the month, it was 49 percent below the level one year earlier. Would-be buyers in this price range have been subjected to a significant proportion of the job cuts that occurred during the recession. Even so, listings on the market sold quickly. In January, the months supply was just 1.3.
Monthly Statistics for Single Family Home Below $250k
Home Demand Index
55
(Limited)
Home Demand Index from prior month
55
Home Demand Index from prior year
108
Months of inventory
1.3
Average daily inventory last month
299
Inventory sold last month
232
Bright MLS | T3 Home Demand Index
www.homedemandindex.com
Download tile as an image.
Baltimore | February 2021
Single Family Home $250k - $590k
Buyer interest in mid-priced single-family homes rose in January by a modest 10 percent to a reading of Steady. Despite the increase, the Index was 10 percent lower than the same time last year. For buyers in this segment, which accounted for nearly 30 percent of sales in January, inventory was lower than any other home type with just a one-month supply.
Monthly Statistics for Single Family Home $250k - $590k
Home Demand Index
96
(Steady)
Home Demand Index from prior month
87
Home Demand Index from prior year
107
Months of Inventory
1
Average daily inventory last month
830
Inventory sold last month
836
Bright MLS | T3 Home Demand Index
www.homedemandindex.com
Download tile as an image.
Baltimore | February 2021
Single Family Home Above $590k
Demand for higher-priced single-family homes increased by a solid 20 percent in January in contrast to the weaker gains among other single-family home types. Furthermore, buyer interest was higher in January compared with one year earlier. The months supply was up marginally over the month to 1.8, but still at a level that reduced buyers’ options when searching for homes.
Monthly Statistics for Single Family Home Above $590k
Home Demand Index
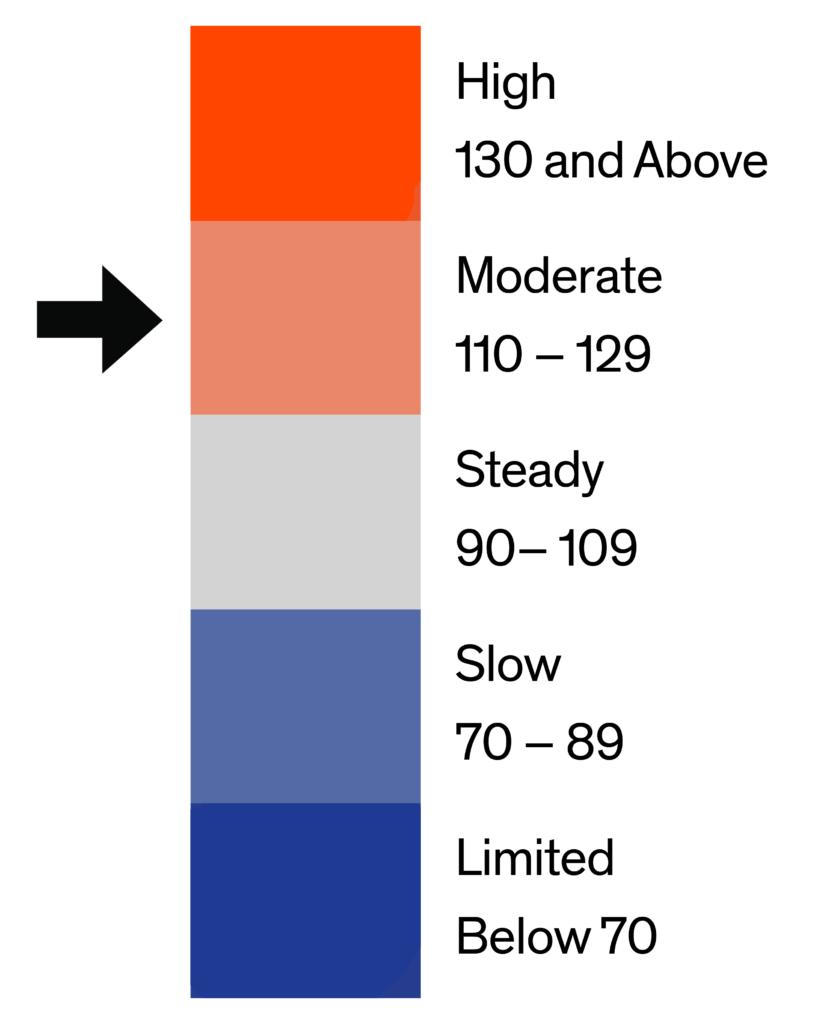
122
(Moderate)
Home Demand Index from prior month
102
Home Demand Index from prior year
111
Months of Inventory
1.8
Average daily inventory last month
467
Inventory sold last month
265
Bright MLS | T3 Home Demand Index
www.homedemandindex.com
Download tile as an image.
Baltimore | February 2021
Condo Below $310k
In January, the Bright MLS | T3 Home Demand Index recorded a Moderate level of buyer interest in condos priced below $310,000. Demand rose during the month and is now consistent with the level one year ago. Would-be buyers were challenged by a low level of inventory with a months supply of only 1.7.
Monthly Statistics for Condo Below $310k
Home Demand Index
112
(Moderate)
Home Demand Index from prior month
97
Home Demand Index from prior year
112
Months of Inventory
1.7
Average daily inventory last month
316
Inventory sold last month
191
Bright MLS | T3 Home Demand Index
www.homedemandindex.com
This is Tooltip!
Baltimore | February 2021
Condo Above $310k
Buyer interest in higher-priced condos remained strong in January with an Index reading in the High demand category. Over the month, demand was up slightly and little changed from the level one year earlier. Inventory conditions were more favorable for buyers with a 3.6 months supply, still low, but higher than any other type of home in January.
Monthly Statistics for Condo Above $310k
Home Demand Index
140
(High)
Home Demand Index from prior month
134
Home Demand Index from prior year
134
Months of Inventory
3.6
Average daily inventory last month
138
Inventory sold last month
38
Bright MLS | T3 Home Demand Index
www.homedemandindex.com
This is Tooltip!
Baltimore | February 2021
Townhouse/Rowhouse/Twin All prices
Townhouse/ Rowhouse/Twin All prices
Demand for townhouses rose by eight percent in January, a marginal increase that reflected a Steady level of buyer interest. Inventory conditions continued to be tight with a months supply of just 1.3, virtually unchanged from the previous month.
Monthly Statistics for Townhouse/Rowhouse/TwinAll prices
Home Demand Index
107
(Steady)
Home Demand Index from prior month
99
Home Demand Index from prior year
110
Months of Inventory
1.3
Average daily inventory last month
1,775
Inventory sold last month
1,370
Bright MLS | T3 Home Demand Index
www.homedemandindex.com
Note
1. This report is generated with data from the following counties: Anne Arundel, MD; Baltimore City, MD; Baltimore, MD; Carroll, MD; Harford, MD; Howard, MD
2. This report is for the February 2021 period with data collected from the previous month.
Released: March 5, 2021
Reference ID: 1101
Baltimore | February 2021
Home Demand Map (Zip Codes)
Within the Baltimore market area, roughly one-quarter of ZIP codes recorded a High or Moderate level of buyer demand. This share was modestly higher than last month as more submarkets recorded increased buyer interest. Demand in more than half of ZIP codes was in the Slow or Limited category, mostly in areas surrounding the urban core and close-in suburban areas.
Bright MLS | T3 Home Demand Index
www.homedemandindex.com
Embed the Timeline
To embed the map on your website, copy and paste the code below. Please note that the ideal dimensions for displaying the map are 1312 pixels wide by 660 pixels high.
Embed the Map
To embed the map on your website, copy and paste the code below. Please note that the ideal dimensions for displaying the map are 1312 pixels wide by 1182 pixels high.
Embed the Housing Type Bar Chart
To embed the map on your website, copy and paste the code below. Please note that the ideal dimensions for displaying the map are 1312 pixels wide by 880 pixels high.