Share report on Facebook!
Share on facebook
Share report on Twitter!
Share on twitter
Share report on LinkedIn!
Share on linkedin
Email a link to this Report!
Share on email
Download tile as an image.

Baltimore | December 2020

Home Demand Index

The Bright MLS | T3 Home Demand Index fell in November to 104, a decline of 24 percent from the previous month. Although declining over the month, buyer interest remained elevated compared to one year ago. Overall, buyer demand in the Baltimore MLS market area can be described as Steady.
The Bright MLS | T3 Home Demand Index declined in November among all types of homes, reflecting the typical end-of-year moderation in buyer interest before the next spring buying season begins. Except for the lowest-priced single-family portion of the market, the level of buyer interest was higher than one year ago, even after the usual seasonal softening of demand.

Among the single-family segments, inventory levels remained exceptionally low, ranging from 0.9 to 1.9 months supply. The supply of homes for sale in other parts of the market was similar and presented a challenge for buyers searching for a home.
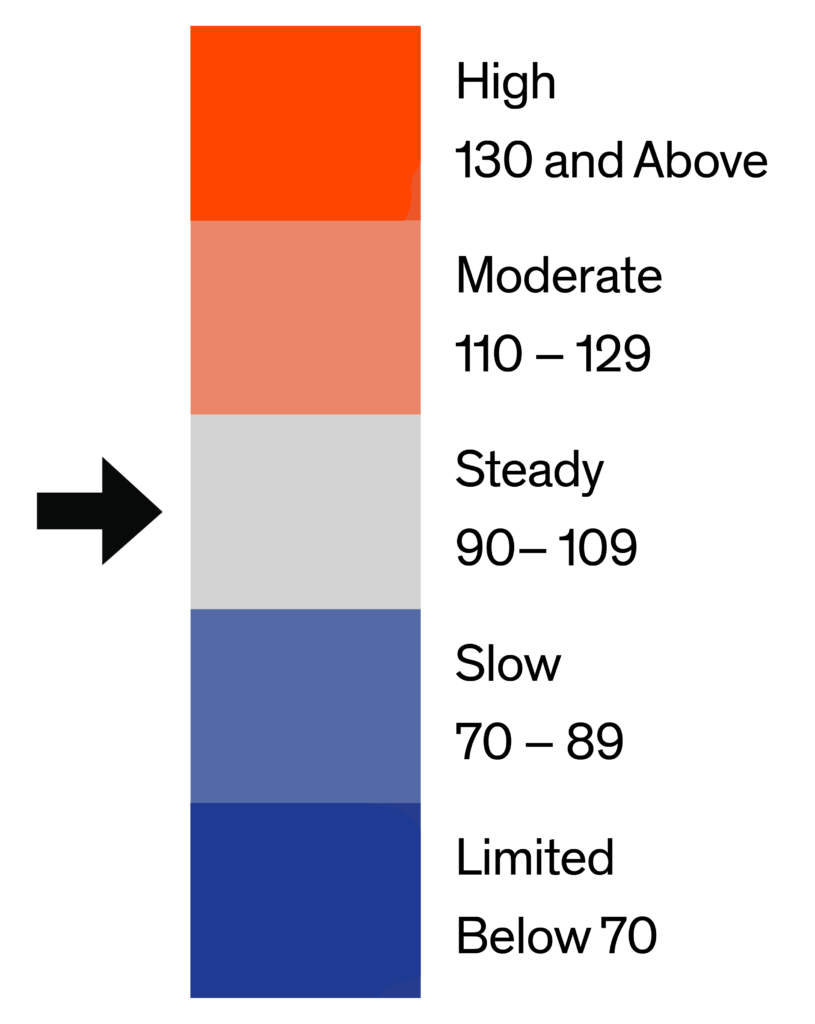
Monthly Statistics for December 2020
Home Demand
Index
104
(Steady)
Home Demand Index
from prior month
136
Home Demand Index
from prior year
90
Index change
from prior month
-23.5%
Index change from
same time last year
15.6%
Bright MLS | T3 Home Demand Index

www.homedemandindex.com

Download tile as an image.
Embed this tile on your site.

Baltimore | December 2020

Home Demand Index | Historical Year-over-Year Comparison

Typically, home demand reaches a peak during the spring buying season, followed by a more-or-less steady decline through the end of the year. In 2020, however, the spring market was delayed as buyers were temporarily sidelined by disruptions related to the Covid-19 pandemic. Since June, the Bright MLS | T3 Home Demand Index has been markedly above the level of one year earlier reflecting not only the delayed spring activity but also intense buyer interest as mortgage interest rates fell to previously unseen lows.

Even with the strength of the real estate market since mid-year, a decline in buyer interest, as shown by the November drop in the Index, is consistent with the usual seasonal slowdown. In 2019 the Index decreased by eight percent in November.

Home Demand Index

Bright MLS | T3 Home Demand Index

www.homedemandindex.com

Download the top-level Market Areas map as a screenshot.

Embed this tile on your site.

Baltimore | December 2020

Home Demand Map

Although home demand in the Baltimore market area softened in November, approximately one-third of ZIP codes recorded buyer interest in the High or Moderate range. Most of these areas were in the eastern portion of the market area, close to the urban core and major transportation routes. In contrast, the Index was in the Slow or Limited range in 40 percent of ZIP codes clustered to the north and south of areas with the highest level of buyer demand.
Bright MLS | T3 Home Demand Index

www.homedemandindex.com

Download tile as an image.
Embed this tile on your site.

Baltimore | December 2020

Demand and Inventory by Home Type

The Bright MLS | T3 Home Demand Index declined in November among all types of homes, reflecting the typical end-of-year moderation in buyer interest before the next spring buying season begins. Except for the lowest-priced single-family portion of the market, the level of buyer interest was higher than one year ago, even after the usual seasonal softening of demand.

Among the single-family segments, inventory levels remained exceptionally low, ranging from 0.9 to 1.9 months supply. The supply of homes for sale in other parts of the market was similar and presented a challenge for buyers searching for a home.

Bright MLS | T3 Home Demand Index

www.homedemandindex.com

Download tile as an image.

Baltimore | December 2020

Single Family Home Below $250k
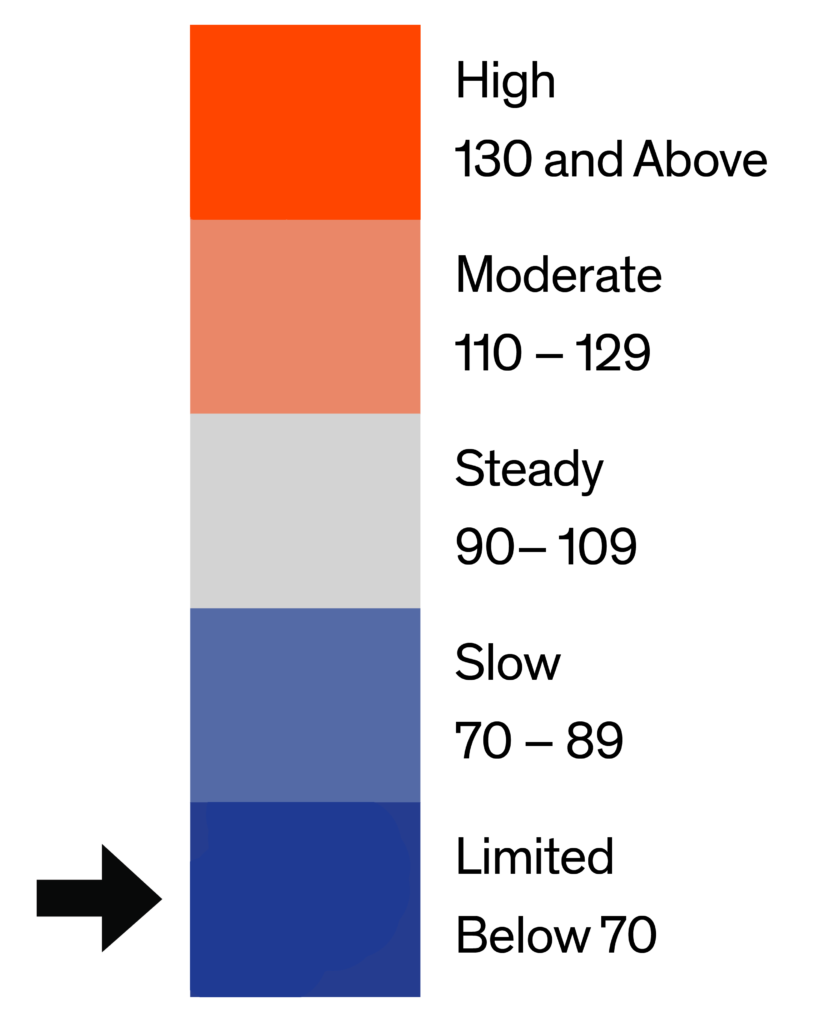
Consistent with previous months, buyer interest in single-family homes priced below $250,000 was lower than any other type of home. In November, the Index posted a reading of 64, consistent with a Limited level of demand. Not only did the Index decline by 21 percent compared with the previous month, but the Index was also 30 percent below the level one year ago, the only home type for which the Index was below the previous year’s reading. A lean inventory of homes for sale, just 1.3 months supply in November, also contributed to the softening of demand as buyers searching for homes in this price range faced limited choice along with some of the most significant fallout from the weak economy.
Monthly Statistics for Single Family Home Below $250k
Home Demand
Index
64
(Limited)
Home Demand Index
from prior month
81
Home Demand Index
from prior year
91
Months of
inventory
1.3
Average daily inventory last month
404
Inventory sold
last month
320
Bright MLS | T3 Home Demand Index

www.homedemandindex.com

Download tile as an image.

Baltimore | December 2020

Single Family Home $250k - $590k

The Bright MLS | T3 Home Demand Index for mid-priced single-family homes fell by 26 percent in November. Although a significant drop, the level of buyer interest was higher than one year ago and can be characterized as Steady. Even as demand decreased over the month, the pace of sales relative to inventory was still robust. There was less than a one-month supply of homes on the market in November.
Monthly Statistics for Single Family Home $250k - $590k
Home Demand
Index
106
(Steady)
Home Demand Index
from prior month
143
Home Demand Index
from prior year
90
Months of
Inventory
0.9
Average daily inventory last month
1,192
Inventory sold
last month
1,297
Bright MLS | T3 Home Demand Index

www.homedemandindex.com

Download tile as an image.

Baltimore | December 2020

Single Family Home Above $590k
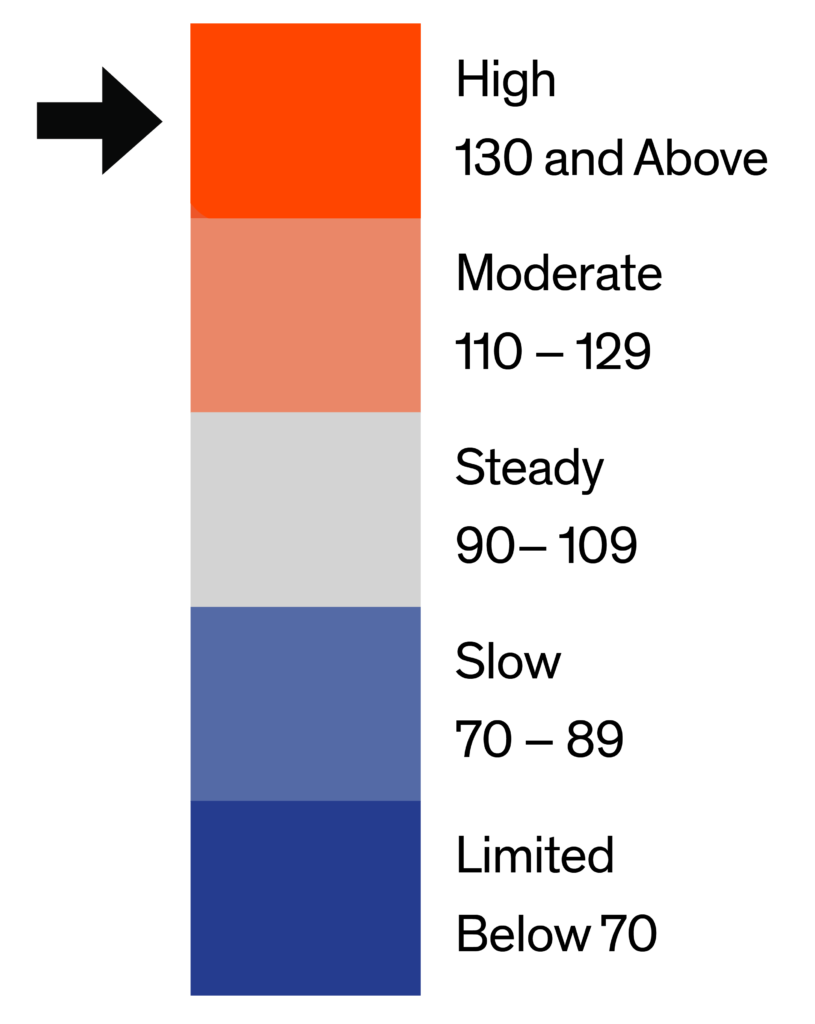
Demand at the higher end of the market, single-family homes priced above $590,000, fell in November. Although decreasing by 32 percent over the month, buyer interest remained elevated compared to one year ago, suggesting that a portion of the drop-off is attributable to a normal seasonal decline in buyer interest following a strong summer and fall. Inventory conditions were very tight in November, with a months supply of just 1.6, far below what is generally considered a balanced market.
Monthly Statistics for Single Family Home Above $590k
Home Demand
Index
131
(High)
Home Demand Index
from prior month
193
Home Demand Index
from prior year
82
Months of
Inventory
1.9
Average daily inventory last month
700
Inventory sold
last month
364
Bright MLS | T3 Home Demand Index

www.homedemandindex.com

Download tile as an image.

Baltimore | December 2020

Condo Below $310k

Demand for lower-priced condos, those priced below $310,000, was in the Steady category reflecting a decrease of 19 percent in November compared with the previous month. Like other types of homes that experienced strong demand in the fall, buyer interest in this condo segment eased but remained well above the level compared with one year ago. The number of properties for sale was low with a 1.8 months supply at the current sales pace.
Monthly Statistics for Condo Below $310k
Home Demand
Index
109
(Steady)
Home Demand Index
from prior month
135
Home Demand Index
from prior year
87
Months of
Inventory
1.8
Average daily inventory last month
381
Inventory sold
last month
208
Bright MLS | T3 Home Demand Index

www.homedemandindex.com

This is Tooltip!

Baltimore | December 2020

Condo Above $310k

Although the smallest part of the market as measured by sales, buyers continued to exhibit a strong interest in condos priced above $310,000. Buyer demand remained High with an elevated Index reading of 160. Inventory conditions were marginally more favorable compared with other segments. The months supply was 3.7 in November.
Monthly Statistics for Condo Above $310k
Home Demand
Index
160
(High)
Home Demand Index
from prior month
195
Home Demand Index
from prior year
81
Months of
Inventory
3.7
Average daily inventory last month
178
Inventory sold
last month
48
Bright MLS | T3 Home Demand Index

www.homedemandindex.com

This is Tooltip!

Baltimore | December 2020

Townhouse/Rowhouse/Twin All prices

Townhouse/
Rowhouse/Twin
All prices
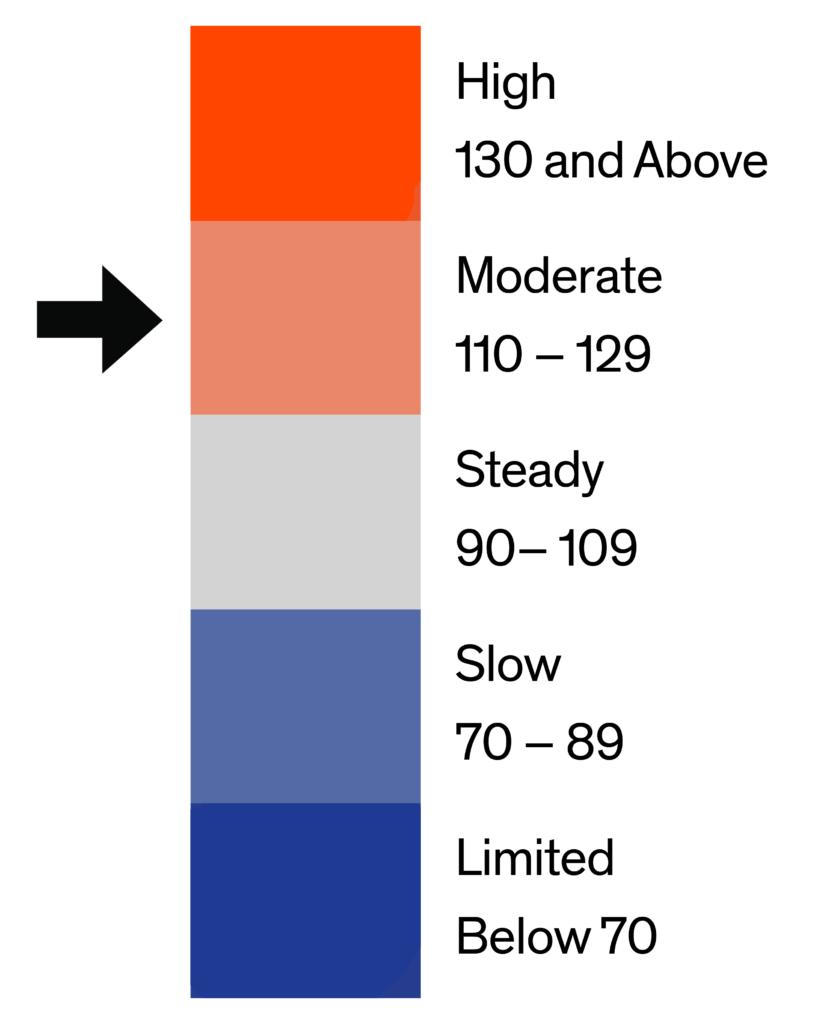
The November Bright MLS | T3 Home Demand Index for the townhouse segment reflected a Moderate level of activity, even after the 20 percent decline over the month. As importantly, the Index was above the level of one year earlier suggesting that buyer interest in this segment of the market remains strong. Buyers looking to purchase a townhouse found that inventory conditions strongly favored sellers with just 1.9 months supply.
Monthly Statistics for Townhouse/Rowhouse/TwinAll prices
Home Demand
Index
115
(Moderate)
Home Demand Index
from prior month
143
Home Demand Index
from prior year
91
Months of
Inventory
1.6
Average daily inventory last month
2,367
Inventory sold
last month
1,527
Bright MLS | T3 Home Demand Index

www.homedemandindex.com

Note

1. This report is generated with data from the following counties: Anne Arundel, MD; Baltimore City, MD; Baltimore, MD; Carroll, MD; Harford, MD; Howard, MD
2. This report is for the December 2020 period with data collected from the previous month.
Released: March 3, 2021
Reference ID: 1064

Baltimore | December 2020

Home Demand Map (Zip Codes)

Although home demand in the Baltimore market area softened in November, approximately one-third of ZIP codes recorded buyer interest in the High or Moderate range. Most of these areas were in the eastern portion of the market area, close to the urban core and major transportation routes. In contrast, the Index was in the Slow or Limited range in 40 percent of ZIP codes clustered to the north and south of areas with the highest level of buyer demand.
Bright MLS | T3 Home Demand Index

www.homedemandindex.com

Embed the Timeline

To embed the map on your website, copy and paste the code below. Please note that the ideal dimensions for displaying the map are 1312 pixels wide by 660 pixels high.

Embed the Map

To embed the map on your website, copy and paste the code below. Please note that the ideal dimensions for displaying the map are 1312 pixels wide by 1182 pixels high.

Embed the Housing Type Bar Chart

To embed the map on your website, copy and paste the code below. Please note that the ideal dimensions for displaying the map are 1312 pixels wide by 880 pixels high.