Share report on Facebook!
Share on facebook
Share report on Twitter!
Share on twitter
Share report on LinkedIn!
Share on linkedin
Email a link to this Report!
Share on email
Download tile as an image.

Baltimore | August 2026

Home Demand Index

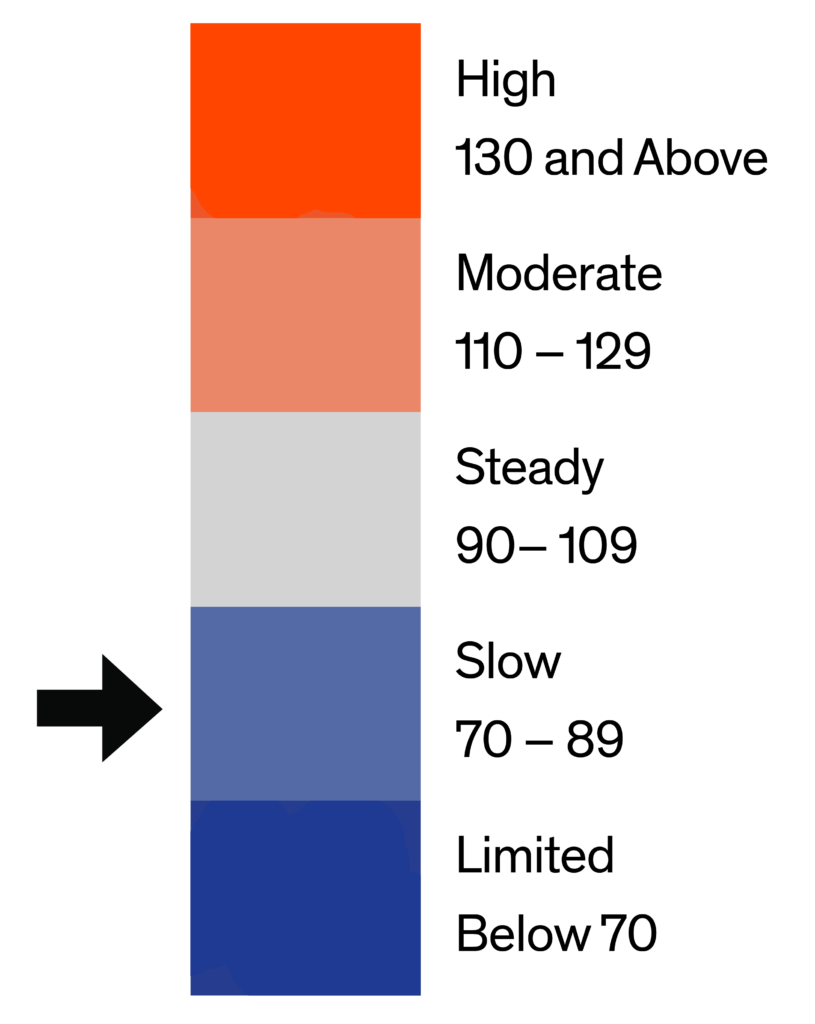
The Home Demand Index (HDI) for the Baltimore metro area stands at 87 for this report period, flat with last month’s 87 and below the 93 recorded during the same period one year ago. The absence of month-over-month movement follows two consecutive months at an identical reading, indicating the metro has settled into a stable plateau rather than continuing the sharper swings that characterized the spring cycle, consistent with the seasonal deceleration that typically sets in as the peak-selling window narrows heading into late summer. The most significant development within the tier structure is the fifty-five-point year-over-year decline in luxury condo demand, the widest single-tier annual gap recorded in this report, which should be read against an unusually strong luxury condo market in August 2025 rather than as evidence of acute current-period weakness in this thin, low-volume segment.
Demand by home type in Baltimore this period shows four of six tiers in Steady territory, with mid single-family remaining in Slow territory and entry single-family remaining in Limited range as the metro’s persistent affordability constraint. Entry single-family rose two points to 68, continuing to reflect the most acute payment-affordability pressure at the sub-$375,000 detached price point, while mid single-family was similarly flat at 85 and remained in Slow territory. Luxury single-family eased six points to 104, remaining comfortably in Steady territory as buyers at these price points remain more insulated from financing-cost sensitivity. Entry condo eased five points to 109 and luxury condo gave back nineteen points to 106, both remaining in Steady territory, though luxury condo’s fifty-five-point year-over-year shortfall is the widest single-tier annual gap in this report and should be read against an unusually strong luxury condo market a year ago rather than current weakness. Townhouse gained one point to 92, remaining in Steady territory and a reasonable proxy for the broader market’s underlying health this period.
Monthly Statistics for August 2026
Home Demand
Index
87
(Slow)
Home Demand Index
from prior month
87
Home Demand Index
from prior year
93
Index change
from prior month
0.0%
Index change from
same time last year
-6.5%
Bright MLS | T3 Home Demand Index

www.homedemandindex.com

Download tile as an image.
Embed this tile on your site.

Baltimore | August 2026

Home Demand Index | Historical Year-over-Year Comparison

Over the past 12 months, Baltimore’s Home Demand Index traced a pronounced seasonal arc, holding in the high 80s and low 90s through last August and September before declining through the fall and bottoming at 57 in December, followed by a recovery that carried through the winter and into a spring peak of 94 in April. The index then eased to 81 in May before climbing back to 87 in both June and July, the current reading, establishing a two-month plateau following the spring peak. At 87, the index trails the 93 posted at this point last year by six points, a gap that has narrowed considerably from the double-digit deficits recorded during the winter months and reflects a market normalizing against a prior-year baseline that is itself moderating through the second half of the year.

Home Demand Index

Bright MLS | T3 Home Demand Index

www.homedemandindex.com

Download the top-level Market Areas map as a screenshot.

Embed this tile on your site.

Baltimore | August 2026

Home Demand Map

Regional demand across the Baltimore metro continues to reflect its established geographic hierarchy, with Howard County the strongest submarket at 127, in Moderate territory and supported by its higher household income profile and comparative insulation from financing-cost sensitivity. Harford (103) and Baltimore County (96) are both in Steady territory, and Anne Arundel (90) has moved into Steady range as well this period, while Carroll (89) sits just below that threshold in Slow territory. Baltimore City remains the softest submarket in the metro at 64, registering in the Limited range where structural affordability barriers and constrained accessible inventory continue to suppress transactional engagement.
Bright MLS | T3 Home Demand Index

www.homedemandindex.com

Download tile as an image.
Embed this tile on your site.

Baltimore | August 2026

Demand and Inventory by Home Type

Demand by home type in Baltimore this period shows four of six tiers in Steady territory, with mid single-family remaining in Slow territory and entry single-family remaining in Limited range as the metro’s persistent affordability constraint. Entry single-family rose two points to 68, continuing to reflect the most acute payment-affordability pressure at the sub-$375,000 detached price point, while mid single-family was similarly flat at 85 and remained in Slow territory. Luxury single-family eased six points to 104, remaining comfortably in Steady territory as buyers at these price points remain more insulated from financing-cost sensitivity. Entry condo eased five points to 109 and luxury condo gave back nineteen points to 106, both remaining in Steady territory, though luxury condo’s fifty-five-point year-over-year shortfall is the widest single-tier annual gap in this report and should be read against an unusually strong luxury condo market a year ago rather than current weakness. Townhouse gained one point to 92, remaining in Steady territory and a reasonable proxy for the broader market’s underlying health this period.
Bright MLS | T3 Home Demand Index

www.homedemandindex.com

Download tile as an image.

Baltimore | August 2026

Single Family Home Below $375k

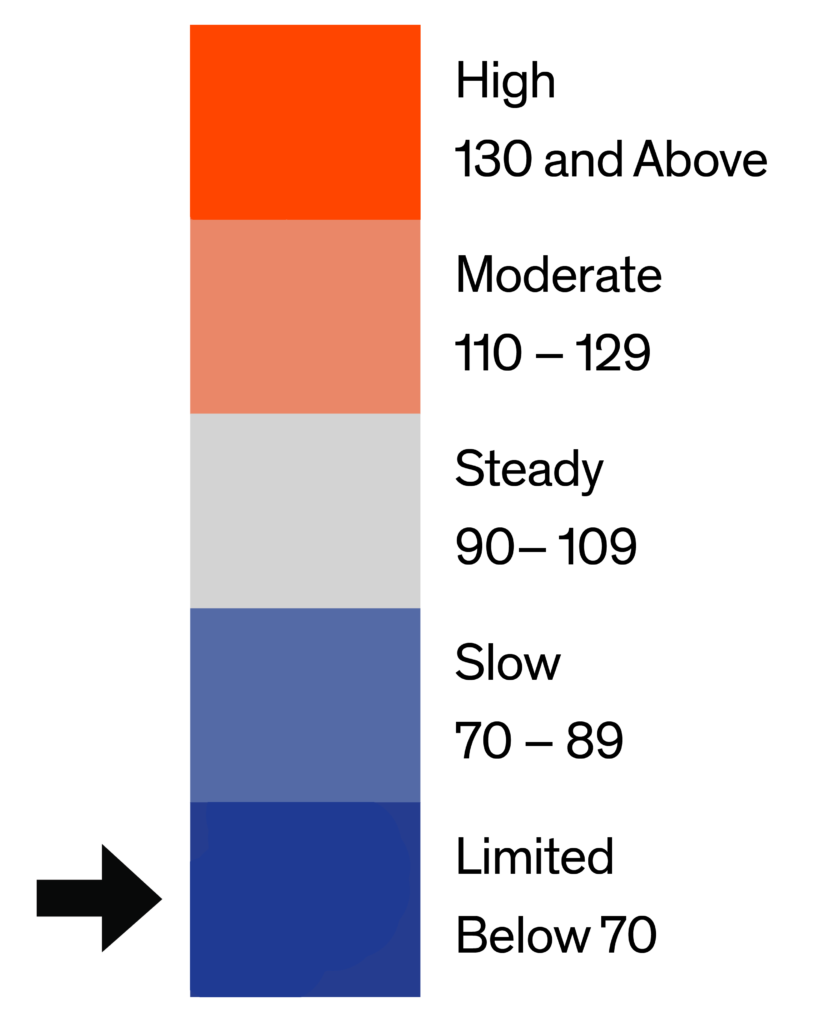
The index for entry-level single-family homes in Baltimore stands at 68 this report period, up two points from 66 last month and below the 75 recorded one year ago. The modest month-over-month gain does little to change the tier’s standing in Limited territory, where the below-$375,000 buyer continues to face the most acute affordability compression in the metro. At 2.2 months of inventory across 687 active listings and 307 monthly sales, supply conditions remain tight enough that the constrained index reading reflects qualification and financing barriers rather than a surplus of available inventory.
Monthly Statistics for Single Family Home Below $375k
Home Demand
Index
68
(Limited)
Home Demand Index
from prior month
66
Home Demand Index
from prior year
75
Months of
inventory
2.2
Average daily inventory last month
687
Inventory sold
last month
307
Bright MLS | T3 Home Demand Index

www.homedemandindex.com

Download tile as an image.

Baltimore | August 2026

Single Family Home $375k - $870k

Mid-range single-family homes in Baltimore registered an index of 85 this report period, flat with last month’s 85 and below the previous year’s reading of 94. The absence of month-over-month movement suggests the move-up buyer cohort in this segment has settled into a stable pace following the spring cycle, neither accelerating nor retreating as the market transitions into late summer. At 1.9 months of inventory across 1,748 active listings and 926 monthly sales, this segment continues to operate with the tightest supply conditions of any single-family tier in the metro, providing a structural floor for demand even as the nine-point year-over-year shortfall persists.
Monthly Statistics for Single Family Home $375k - $870k
Home Demand
Index
85
(Slow)
Home Demand Index
from prior month
85
Home Demand Index
from prior year
94
Months of
Inventory
1.9
Average daily inventory last month
1,748
Inventory sold
last month
926
Bright MLS | T3 Home Demand Index

www.homedemandindex.com

Download tile as an image.

Baltimore | August 2026

Single Family Home Above $870k

The index for luxury single-family homes in Baltimore stands at 104 this report period, down six points from 110 last month and below last year’s reading of 117. The moderate month-over-month decline keeps this tier in Steady territory, reflecting a buyer cohort at the above-$870,000 price point that remains comparatively insulated from financing-cost sensitivity even as the broader market decelerates into late summer. The thirteen-point year-over-year shortfall from last year’s 117 is consistent with the moderation visible across most tiers in this metro this period.
Monthly Statistics for Single Family Home Above $870k
Home Demand
Index
104
(Steady)
Home Demand Index
from prior month
110
Home Demand Index
from prior year
117
Months of
Inventory
2.3
Average daily inventory last month
688
Inventory sold
last month
298
Bright MLS | T3 Home Demand Index

www.homedemandindex.com

Download tile as an image.

Baltimore | August 2026

Condo Below $420k

Entry-level condo demand in Baltimore stands at 109 this report period, down five points from 114 last month and below last year’s level of 122. The modest pullback keeps this segment in Steady territory, continuing to outperform the entry single-family tier by a wide margin and reinforcing the metro’s persistent affordability-driven substitution dynamic. The thirteen-point year-over-year shortfall reflects a moderation from an unusually strong prior-year reading rather than a deterioration in current buyer engagement.
Monthly Statistics for Condo Below $420k
Home Demand
Index
109
(Steady)
Home Demand Index
from prior month
114
Home Demand Index
from prior year
122
Months of
Inventory
3.8
Average daily inventory last month
610
Inventory sold
last month
161
Bright MLS | T3 Home Demand Index

www.homedemandindex.com

This is Tooltip!

Baltimore | August 2026

Condo Above $420k

Luxury condo demand in Baltimore registered 106 this report period, down nineteen points from 125 last month and below last year’s level of 161. The nineteen-point month-over-month decline is the most significant sequential move recorded in this metro this period, though at just 130 active listings and 39 monthly sales, this remains a thin market where modest shifts in transaction volume can produce outsized index movement. The fifty-five-point year-over-year shortfall from last year’s 161 is the widest annual gap of any tier in this report and should be read primarily as a function of an exceptionally strong August 2025 baseline in this segment rather than a signal of acute current-period weakness.
Monthly Statistics for Condo Above $420k
Home Demand
Index
106
(Steady)
Home Demand Index
from prior month
125
Home Demand Index
from prior year
161
Months of
Inventory
3.3
Average daily inventory last month
130
Inventory sold
last month
39
Bright MLS | T3 Home Demand Index

www.homedemandindex.com

This is Tooltip!

Baltimore | August 2026

Townhouse/Rowhouse/Twin All prices

Townhouse/
Rowhouse/Twin
All prices

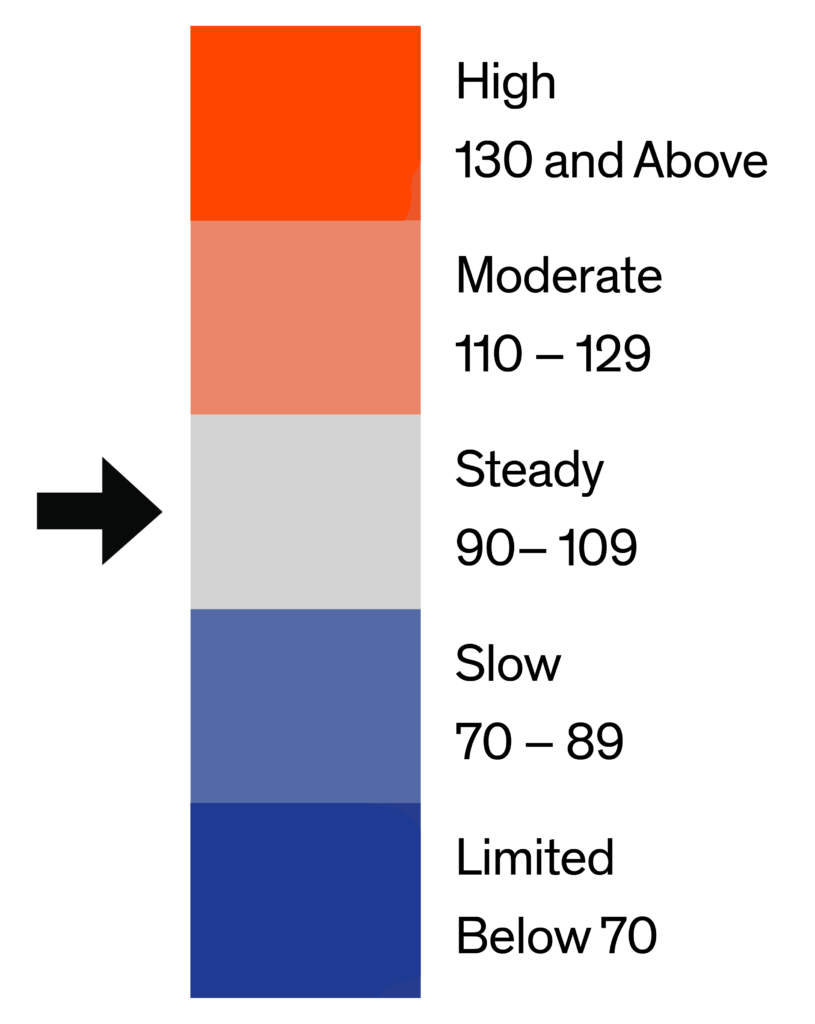
The index for townhouses, rowhouses, and twin homes in Baltimore stands at 92 this report period, up one point from 91 last month and below last year’s level of 94. The essentially flat reading keeps this segment in Steady territory, the narrowest year-over-year gap of any tier in the metro at just two points, indicating that demand in this high-volume format has normalized more fully against its prior-year baseline than any other segment covered in this report. At 3.6 months of inventory across 3,647 active listings and 1,000 monthly sales, this remains the highest-volume tier in the Baltimore metro, and its stability this period is a constructive signal for the broader market’s underlying health heading into late summer.
Monthly Statistics for Townhouse/Rowhouse/TwinAll prices
Home Demand
Index
92
(Steady)
Home Demand Index
from prior month
91
Home Demand Index
from prior year
94
Months of
Inventory
3.6
Average daily inventory last month
3,647
Inventory sold
last month
1,000
Bright MLS | T3 Home Demand Index

www.homedemandindex.com

Note

1. This report is generated with data from the following counties:
  • Baltimore Metro – Anne Arundel, MD; Baltimore City, MD; Baltimore, MD; Carroll, MD; Harford, MD; Howard, MD;
  • DelMar Coastal – Somerset, MD; Sussex, DE; Wicomico, MD; Worcester, MD;
  • Maryland Eastern Shore – Caroline, MD; Cecil, MD; Dorchester, MD; Kent, MD; Queen Annes, MD; Talbot, MD;

2. This report is for the August 2026 period with data collected from the previous month.
Released: August 10, 2026
Reference ID: 2470

Baltimore | August 2026

Home Demand Map (Zip Codes)

Regional demand across the Baltimore metro continues to reflect its established geographic hierarchy, with Howard County the strongest submarket at 127, in Moderate territory and supported by its higher household income profile and comparative insulation from financing-cost sensitivity. Harford (103) and Baltimore County (96) are both in Steady territory, and Anne Arundel (90) has moved into Steady range as well this period, while Carroll (89) sits just below that threshold in Slow territory. Baltimore City remains the softest submarket in the metro at 64, registering in the Limited range where structural affordability barriers and constrained accessible inventory continue to suppress transactional engagement.
Bright MLS | T3 Home Demand Index

www.homedemandindex.com

Embed the Timeline

To embed the map on your website, copy and paste the code below. Please note that the ideal dimensions for displaying the map are 1312 pixels wide by 660 pixels high.

Embed the Map

To embed the map on your website, copy and paste the code below. Please note that the ideal dimensions for displaying the map are 1312 pixels wide by 1182 pixels high.

Embed the Housing Type Bar Chart

To embed the map on your website, copy and paste the code below. Please note that the ideal dimensions for displaying the map are 1312 pixels wide by 880 pixels high.