Share report on Facebook!
Share on facebook
Share report on Twitter!
Share on twitter
Share report on LinkedIn!
Share on linkedin
Email a link to this Report!
Share on email
Download tile as an image.

Baltimore | April 2026

Home Demand Index

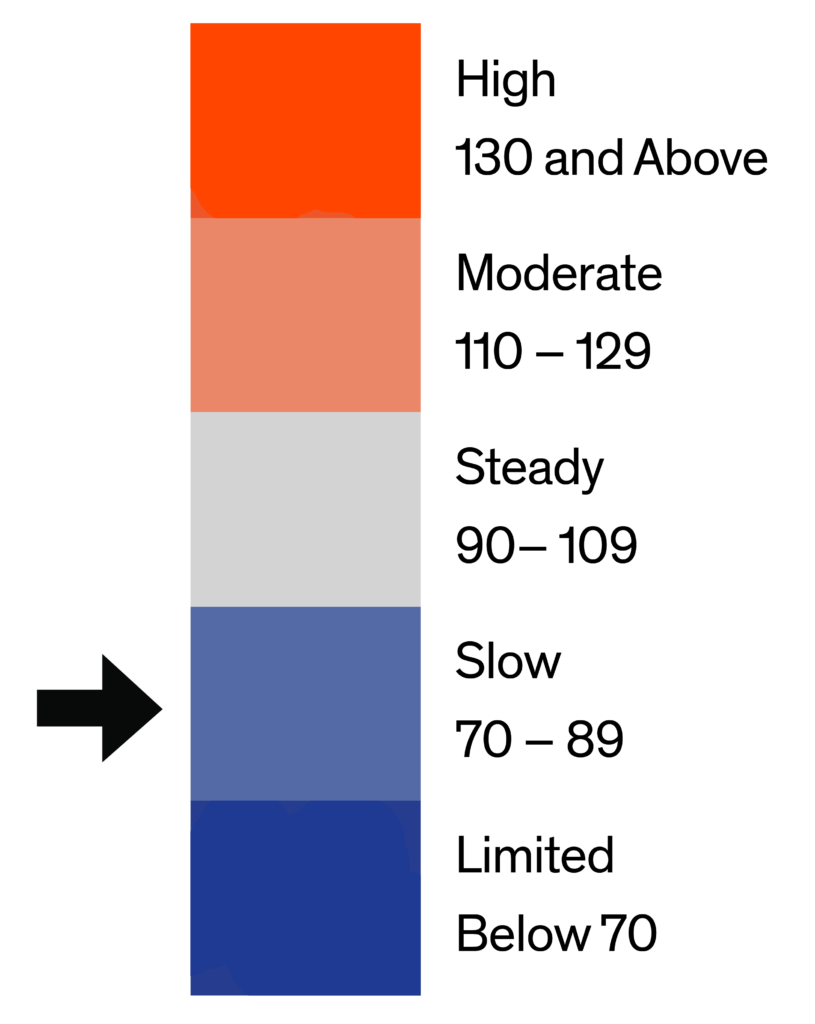
The Home Demand Index (HDI) for the Baltimore metro area stands at 86 for this report period, up notably from 76 last month but below the 93 recorded during the same period one year ago. This meaningful month-over-month acceleration signals a decisive spring reactivation in buyer engagement, consistent with Baltimore’s historical pattern of demand strengthening through April as seasonal inventory and buyer urgency converge. Despite the annual shortfall, the rebound suggests improving momentum, indicating that the affordability and rate headwinds that suppressed activity through the winter are beginning to ease as conditions stabilize.
Demand by home type in Baltimore shows broad-based improvement this period, with most segments posting meaningful month-over-month gains as spring buyer activity accelerates, though all segments remain below year-ago levels. Entry-level single-family homes registered an index of 71, up from 69 last month and below the 76 posted one year ago, reflecting improving first-time buyer engagement though affordability constraints continue to cap the pace of recovery in this rate-sensitive tier. Mid-range single-family homes advanced to 80 from 67 last month, but remain below last year’s reading of 88, suggesting move-up buyer activity is building meaningful spring momentum after a subdued winter. Luxury single-family homes climbed to 84 from 70 last month, but remain below last year’s 104, pointing to selective but expanding high-end engagement as spring inventory enters the market. Entry-level condos rose to 116 from 110 last month, but remain below last year’s 136, reinforcing their position as the most consistently active demand tier in the metro and a primary affordability alternative for buyers navigating constrained detached home budgets. Luxury condos advanced to 149 from 114 last month, though still trailing last year’s 160, as the high-end attached segment continues to normalize following an elevated prior-spring period that may have pulled forward activity. Townhouses, rowhouses, and twin homes rose strongly to 94 from 85 last month, slightly below last year’s 98, signaling that this segment is nearing prior-spring demand levels and is benefiting robustly from spring buyer reactivation.
Monthly Statistics for April 2026
Home Demand
Index
86
(Slow)
Home Demand Index
from prior month
76
Home Demand Index
from prior year
93
Index change
from prior month
13.2%
Index change from
same time last year
-7.5%
Bright MLS | T3 Home Demand Index

www.homedemandindex.com

Download tile as an image.
Embed this tile on your site.

Baltimore | April 2026

Home Demand Index | Historical Year-over-Year Comparison

Over the past 12 months, Baltimore’s Home Demand Index traced a familiar seasonal trajectory, peaking in the mid-to-upper 90s during the spring and early summer before declining through the fall and winter, bottoming in December and January before staging a recovery in February, March, and now April. The current reading of 86 represents a strong month-over-month gain from 76 last month, but remains below the 93 recorded during the same period last year. The line chart now shows the current cycle’s trajectory converging with last year’s levels, signaling that Baltimore’s spring recovery is gaining traction and may be approaching full year-over-year alignment if affordability conditions hold through peak season.

Home Demand Index

Bright MLS | T3 Home Demand Index

www.homedemandindex.com

Download the top-level Market Areas map as a screenshot.

Embed this tile on your site.

Baltimore | April 2026

Home Demand Map

Regional demand across the Baltimore metro has strengthened broadly this period, with the suburban counties that have consistently outperformed now tracking more firmly above the metro-wide index of 86. Howard and Baltimore counties are likely registering the highest demand readings in the metro, supported by their combination of relative affordability at accessible price points, and continued move-up buyer activity from established households. Harford and Anne Arundel counties are tracking near the metro-wide index, reflecting solid but measured engagement, while Carroll County and Baltimore City continue to represent the softest submarkets in the region, where affordability friction and more cautious buyer sentiment remain the dominant constraint on demand expansion.
Bright MLS | T3 Home Demand Index

www.homedemandindex.com

Download tile as an image.
Embed this tile on your site.

Baltimore | April 2026

Demand and Inventory by Home Type

Demand by home type in Baltimore shows broad-based improvement this period, with most segments posting meaningful month-over-month gains as spring buyer activity accelerates, though all segments remain below year-ago levels. Entry-level single-family homes registered an index of 71, up from 69 last month and below the 76 posted one year ago, reflecting improving first-time buyer engagement though affordability constraints continue to cap the pace of recovery in this rate-sensitive tier. Mid-range single-family homes advanced to 80 from 67 last month, but remain below last year’s reading of 88, suggesting move-up buyer activity is building meaningful spring momentum after a subdued winter. Luxury single-family homes climbed to 84 from 70 last month, but remain below last year’s 104, pointing to selective but expanding high-end engagement as spring inventory enters the market. Entry-level condos rose to 116 from 110 last month, but remain below last year’s 136, reinforcing their position as the most consistently active demand tier in the metro and a primary affordability alternative for buyers navigating constrained detached home budgets. Luxury condos advanced to 149 from 114 last month, though still trailing last year’s 160, as the high-end attached segment continues to normalize following an elevated prior-spring period that may have pulled forward activity. Townhouses, rowhouses, and twin homes rose strongly to 94 from 85 last month, slightly below last year’s 98, signaling that this segment is nearing prior-spring demand levels and is benefiting robustly from spring buyer reactivation.
Bright MLS | T3 Home Demand Index

www.homedemandindex.com

Download tile as an image.

Baltimore | April 2026

Single Family Home Below $375k

The index for entry-level single-family homes in Baltimore stands at 71 this report period, up from 69 last month and still below last year’s reading of 76. The month-over-month gain signals that first-time and value-driven buyers are re-engaging with meaningful spring urgency following a subdued winter stretch, consistent with seasonal reactivation patterns in this tier. While demand has not yet fully recaptured last April’s level, the directional momentum is positive, and the narrowing year-over-year gap suggests affordability constraints, while still present, are no longer as acutely suppressing buyer engagement as they were through the winter months.
Monthly Statistics for Single Family Home Below $375k
Home Demand
Index
71
(Slow)
Home Demand Index
from prior month
69
Home Demand Index
from prior year
76
Months of
inventory
2.5
Average daily inventory last month
584
Inventory sold
last month
238
Bright MLS | T3 Home Demand Index

www.homedemandindex.com

Download tile as an image.

Baltimore | April 2026

Single Family Home $375k - $850k

Mid-range single-family homes in Baltimore registered an index of 80 this report period, up substantially from 67 last month and approaching last year’s reading of 88. The thirteen-point month-over-month acceleration reflects a meaningful increase in move-up buyer activity as spring conditions take hold, consistent with the strong sequential improvement pattern visible across the metro this period. The eight-point year-over-year shortfall indicates that while the recovery trajectory is encouraging, qualified move-up households remain somewhat more restrained than last April, balancing current financing costs against price expectations in a segment where inventory alignment with buyer budgets continues to drive decision timing.
Monthly Statistics for Single Family Home $375k - $850k
Home Demand
Index
80
(Slow)
Home Demand Index
from prior month
67
Home Demand Index
from prior year
88
Months of
Inventory
1.8
Average daily inventory last month
1,123
Inventory sold
last month
617
Bright MLS | T3 Home Demand Index

www.homedemandindex.com

Download tile as an image.

Baltimore | April 2026

Single Family Home Above $850k

The index for luxury single-family homes in Baltimore stands at 84 this report period, up from 70 last month but still below last year’s reading of 104. The fourteen-point month-over-month gain reflects meaningful reactivation among high-end buyers entering the spring market, as discretionary purchasers who had stepped back during the winter re-engage with greater willingness. The twenty-point year-over-year gap is the most significant shortfall across all single-family tiers in Baltimore this period, suggesting that luxury buyers remain more selective and deliberate than at the same point last year — a pattern likely reflecting sensitivity to economic uncertainty, pricing expectations, and the discretionary nature of high-end purchase decisions in the current environment.
Monthly Statistics for Single Family Home Above $850k
Home Demand
Index
84
(Slow)
Home Demand Index
from prior month
70
Home Demand Index
from prior year
104
Months of
Inventory
2.7
Average daily inventory last month
377
Inventory sold
last month
139
Bright MLS | T3 Home Demand Index

www.homedemandindex.com

Download tile as an image.

Baltimore | April 2026

Condo Below $403k

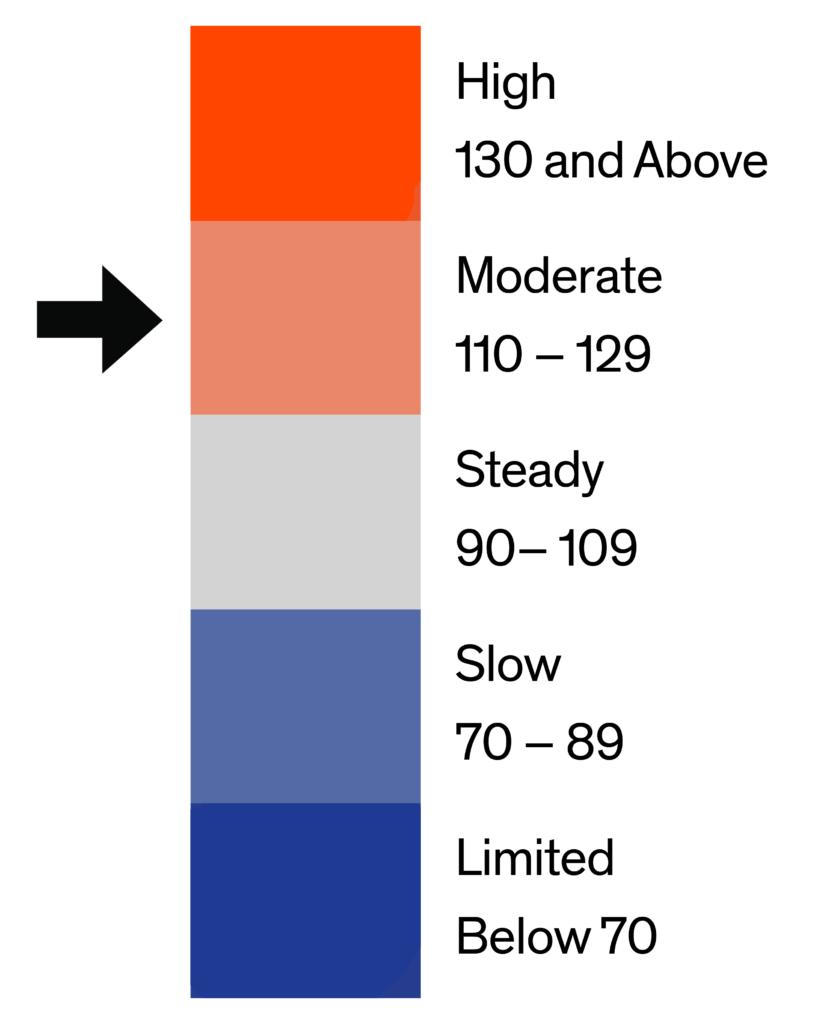
Entry-level condo demand in Baltimore stands at 116 this report period, up from 110 last month but below last year’s level of 136. The six-point month-over-month improvement signals continued strengthening buyer interest in more accessible, lower-maintenance housing options as spring demand builds across the metro. At 116, this segment continues to outperform all single-family categories, reinforcing condos’ role as the primary affordability outlet for buyers navigating a market where detached home price points continue to exceed the reach of a meaningful share of active buyers.
Monthly Statistics for Condo Below $403k
Home Demand
Index
116
(Moderate)
Home Demand Index
from prior month
110
Home Demand Index
from prior year
136
Months of
Inventory
3.3
Average daily inventory last month
502
Inventory sold
last month
153
Bright MLS | T3 Home Demand Index

www.homedemandindex.com

This is Tooltip!

Baltimore | April 2026

Condo Above $403k

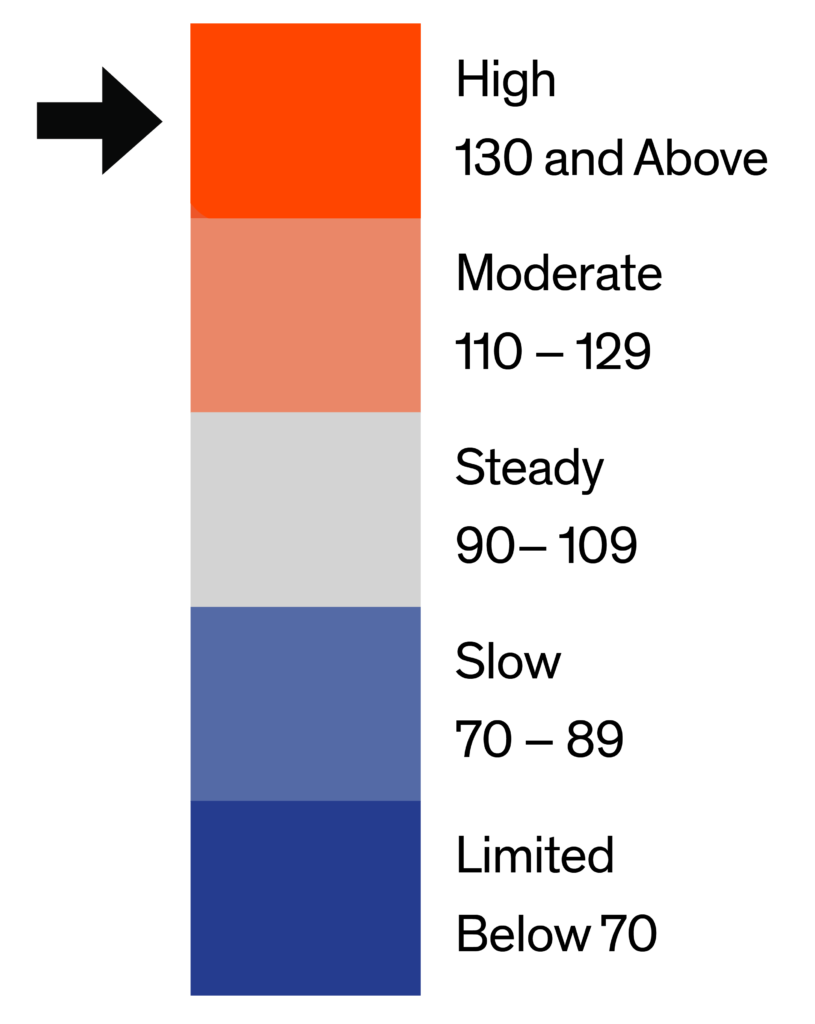
Luxury condo demand in Baltimore registered 149 this report period, up substantially from 114 last month but below last year’s level of 160. The thirty-five-point month-over-month rebound signals a pronounced spring reactivation among affluent condo buyers, consistent with the lifestyle-driven and downsizing demand patterns that typically accelerate in this segment as the selling season opens. The eleven-point year-over-year softening indicates some normalization from last spring’s elevated pace, though at 149 this segment retains one of the strongest absolute index readings across the Baltimore metro and continues to attract sustained interest from buyers drawn to premium urban inventory and amenity-rich attached living.
Monthly Statistics for Condo Above $403k
Home Demand
Index
149
(High)
Home Demand Index
from prior month
114
Home Demand Index
from prior year
160
Months of
Inventory
5.3
Average daily inventory last month
127
Inventory sold
last month
24
Bright MLS | T3 Home Demand Index

www.homedemandindex.com

This is Tooltip!

Baltimore | April 2026

Townhouse/Rowhouse/Twin All prices

Townhouse/
Rowhouse/Twin
All prices

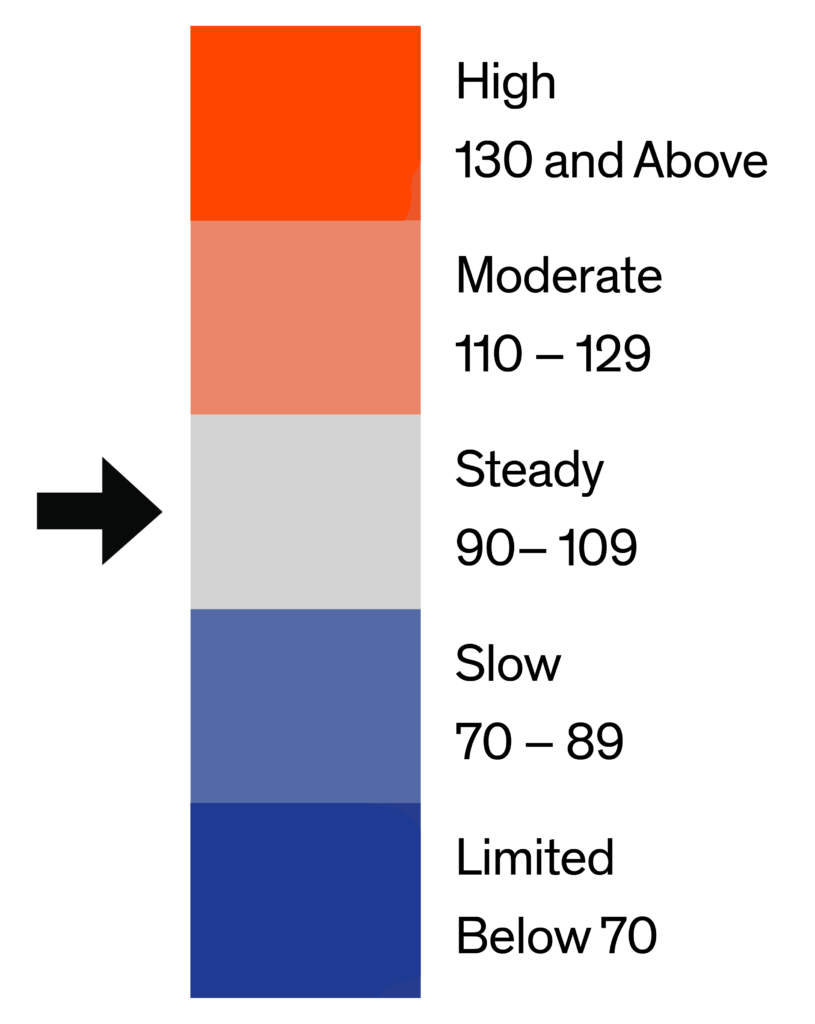
The index for townhouses, rowhouses, and twin homes in Baltimore stands at 94 this report period, up from 85 last month but below last year’s level of 98. The nine-point month-over-month improvement reflects building buyer momentum in the attached single-family segment as spring conditions take hold, consistent with this category’s appeal among buyers seeking a combination of space, location, and relative price efficiency in a market where detached single-family affordability remains strained. The four-point year-over-year gap suggests the segment is tracking slightly below last spring’s pace, though its value positioning and established neighborhood presence continue to sustain a strong floor of buyer engagement that positions it as one of the more resilient demand categories across the Baltimore metro this period.
Monthly Statistics for Townhouse/Rowhouse/TwinAll prices
Home Demand
Index
94
(Steady)
Home Demand Index
from prior month
85
Home Demand Index
from prior year
98
Months of
Inventory
3.4
Average daily inventory last month
2,779
Inventory sold
last month
819
Bright MLS | T3 Home Demand Index

www.homedemandindex.com

Note

1. This report is generated with data from the following counties:
  • Baltimore Metro – Anne Arundel, MD; Baltimore City, MD; Baltimore, MD; Carroll, MD; Harford, MD; Howard, MD;
  • DelMar Coastal – Somerset, MD; Sussex, DE; Wicomico, MD; Worcester, MD;
  • Maryland Eastern Shore – Caroline, MD; Cecil, MD; Dorchester, MD; Kent, MD; Queen Annes, MD; Talbot, MD;

2. This report is for the April 2026 period with data collected from the previous month.
Released: April 13, 2026
Reference ID: 2405

Baltimore | April 2026

Home Demand Map (Zip Codes)

Regional demand across the Baltimore metro has strengthened broadly this period, with the suburban counties that have consistently outperformed now tracking more firmly above the metro-wide index of 86. Howard and Baltimore counties are likely registering the highest demand readings in the metro, supported by their combination of relative affordability at accessible price points, and continued move-up buyer activity from established households. Harford and Anne Arundel counties are tracking near the metro-wide index, reflecting solid but measured engagement, while Carroll County and Baltimore City continue to represent the softest submarkets in the region, where affordability friction and more cautious buyer sentiment remain the dominant constraint on demand expansion.
Bright MLS | T3 Home Demand Index

www.homedemandindex.com

Embed the Timeline

To embed the map on your website, copy and paste the code below. Please note that the ideal dimensions for displaying the map are 1312 pixels wide by 660 pixels high.

Embed the Map

To embed the map on your website, copy and paste the code below. Please note that the ideal dimensions for displaying the map are 1312 pixels wide by 1182 pixels high.

Embed the Housing Type Bar Chart

To embed the map on your website, copy and paste the code below. Please note that the ideal dimensions for displaying the map are 1312 pixels wide by 880 pixels high.