April 2024 Report
Baltimore Metro
Baltimore | April 2024
Home Demand Index
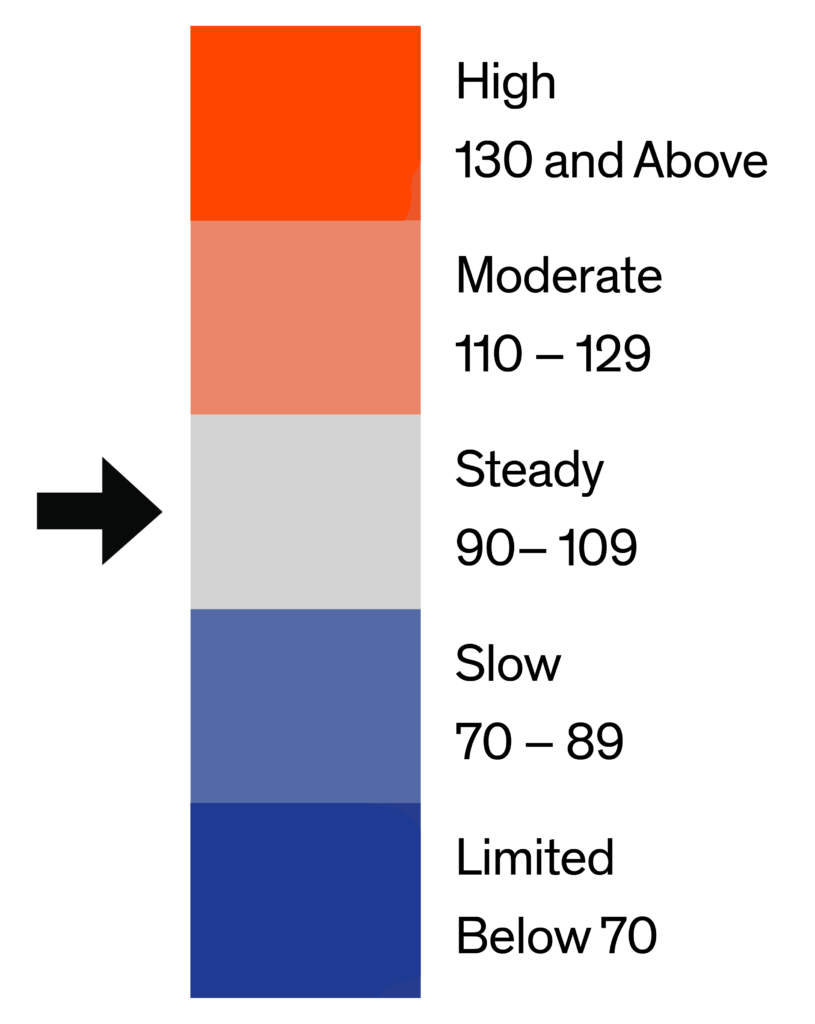
The Bright MLS | T3 Home Demand Index for the Baltimore Metro area rose 4.8 percent in March to 87, a level consistent with Slow buyer demand. The Index was in the Slow category in February as well and just 1.1 percent lower than one year earlier.
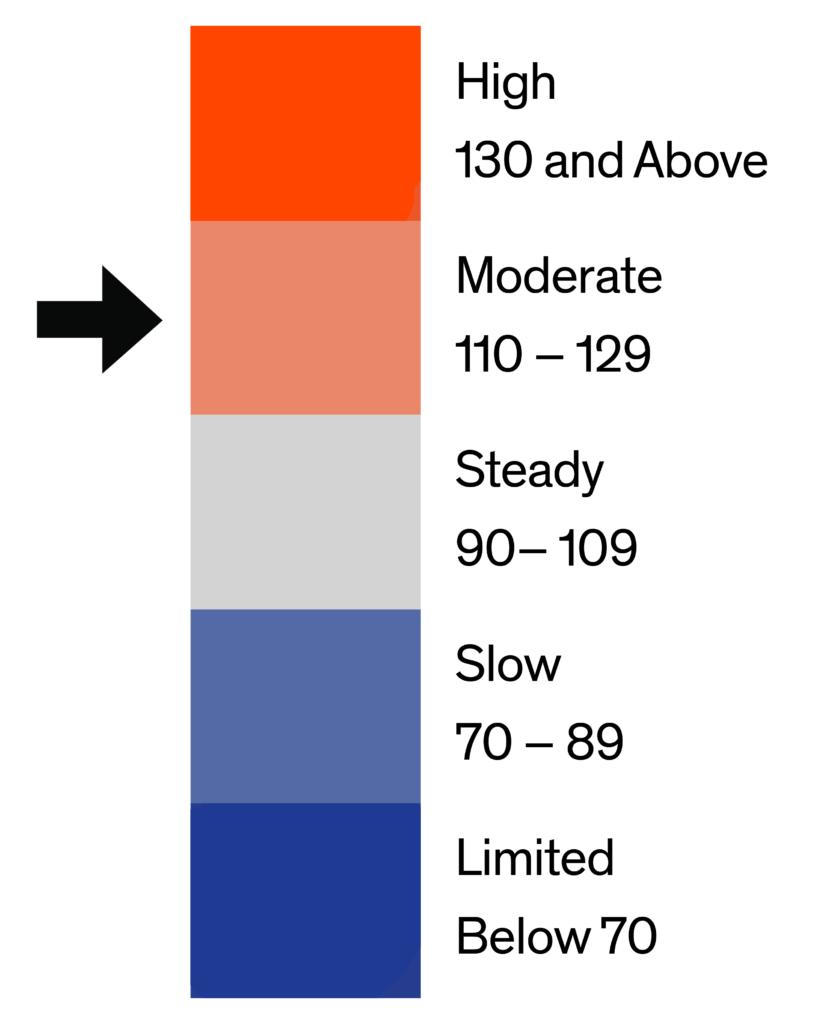
The Bright MLS | T3 Home Demand Index for most types of homes increased in March, the only exception being entry-level single-family homes. Among the types of homes with increased buyer interest, the Index rose by 6 to 7 percent over the month. Demand for luxury condos was in the Moderate category while entry-level condos, luxury single-family homes and townhouses attracted Steady buyer interest. Demand was Slow in the remaining market segments. The months supply ranged from 1.3 months for mid-market single-family homes to 2.4 months for luxury single-family homes and luxury condos.

Monthly Statistics for April 2024
Home Demand
Index
Index
87
(Slow)
Home Demand Index
from prior month
from prior month
83
Home Demand Index
from prior year
from prior year
88
Index change
from prior month
from prior month
4.8%
Index change from
same time last year
same time last year
-1.1%
Bright MLS | T3 Home Demand Index
www.homedemandindex.com
Baltimore | April 2024
Home Demand Index | Historical Year-over-Year Comparison
Demand for homes in the Baltimore Metro area rose for the third consecutive month in March following a period of little change during the fall and early winter months. Demand has tracked the year-earlier level for the past two months suggesting that homebuying this spring may mirror last year’s pace of activity. Mortgage rates have been just under 7 percent for the past several weeks while there are signs that the inventory of homes for sale has been increasing just in time for peak springtime homebuying.
Home Demand Index
Bright MLS | T3 Home Demand Index
www.homedemandindex.com
Baltimore | April 2024
Home Demand Map
Buyer interest in homes was Steady in Howard, Baltimore and Harford counties and Slow in the other metro area counties. The Index was higher in each metro area county compared with February. Demand was Moderate in the DelMar Coastal region and Steady in the Maryland Eastern Shore area. Across the Greater Baltimore area, demand in one-third of ZIP codes was High or Moderate, up from one-quarter of communities in February. Buyer interest in half of ZIP codes was in the Slow or Limited range in March, a decrease from 59 percent the previous month.
Bright MLS | T3 Home Demand Index
www.homedemandindex.com
Baltimore | April 2024
Demand and Inventory by Home Type
The Bright MLS | T3 Home Demand Index for most types of homes increased in March, the only exception being entry-level single-family homes. Among the types of homes with increased buyer interest, the Index rose by 6 to 7 percent over the month. Demand for luxury condos was in the Moderate category while entry-level condos, luxury single-family homes and townhouses attracted Steady buyer interest. Demand was Slow in the remaining market segments. The months supply ranged from 1.3 months for mid-market single-family homes to 2.4 months for luxury single-family homes and luxury condos.
Bright MLS | T3 Home Demand Index
www.homedemandindex.com
Baltimore | April 2024
Single Family Home Below $345k
The Index for entry-level single-family homes fell 5 percent in March and continued to reflect demand in the Slow category. Moreover, demand was weaker than any other segment of the Baltimore Metro area market. The Index was 8 percent lower compared with one year earlier. The months supply, at 1.5, was down from 2.1 months in February.

Monthly Statistics for Single Family Home Below $345k
Home Demand
Index
Index
71
(Slow)
Home Demand Index
from prior month
from prior month
75
Home Demand Index
from prior year
from prior year
77
Months of
inventory
inventory
1.5
Average daily inventory last month
390
Inventory sold
last month
last month
262
Bright MLS | T3 Home Demand Index
www.homedemandindex.com
Baltimore | April 2024
Single Family Home $345k - $791k
Buyer interest in mid-market single-family homes was up somewhat in March according to the Bright MLS | T3 Home Demand Index. The Index, at 83, was consistent with a Slow pace of demand. Compared with one year earlier, the Index was just 1 percent lower. There was a 1.3 months supply of homes available for sale, down from 1.7 months in February.

Monthly Statistics for Single Family Home $345k - $791k
Home Demand
Index
Index
83
(Slow)
Home Demand Index
from prior month
from prior month
78
Home Demand Index
from prior year
from prior year
84
Months of
Inventory
Inventory
1.3
Average daily inventory last month
838
Inventory sold
last month
last month
631
Bright MLS | T3 Home Demand Index
www.homedemandindex.com
Baltimore | April 2024
Single Family Home Above $791k
The Bright MLS | T3 Home Demand Index for luxury single-family homes increased 6 percent in March to 91 reflecting a Steady level of buyer interest. Despite the increase, the Index was 9 percent lower than one year earlier. The months supply of homes, at 2.4, was down from 3 months in February.

Monthly Statistics for Single Family Home Above $791k
Home Demand
Index
Index
91
(Steady)
Home Demand Index
from prior month
from prior month
86
Home Demand Index
from prior year
from prior year
100
Months of
Inventory
Inventory
2.4
Average daily inventory last month
355
Inventory sold
last month
last month
149
Bright MLS | T3 Home Demand Index
www.homedemandindex.com
Baltimore | April 2024
Condo Below $399k
Demand for entry-level condos was somewhat higher in March according to the Bright MLS | T3 Home Demand Index. At 109, the Index was consistent with a Steady pace of buyer interest. There was a 1.8 months supply of homes available for sale, down from 2.3 months in February.

Monthly Statistics for Condo Below $399k
Home Demand
Index
Index
109
(Steady)
Home Demand Index
from prior month
from prior month
103
Home Demand Index
from prior year
from prior year
104
Months of
Inventory
Inventory
1.8
Average daily inventory last month
270
Inventory sold
last month
last month
147
Bright MLS | T3 Home Demand Index
www.homedemandindex.com
Baltimore | April 2024
Condo Above $399k
Demand for luxury condos was higher in March, with the Index increasing 7 percent over the month to 123, a level consistent with a Moderate pace of buyer interest. Compared with one year earlier, the Index was 13 percent lower. The months supply, at 2.4 months, was down from 3.2 months in February.

Monthly Statistics for Condo Above $399k
Home Demand
Index
Index
123
(Moderate)
Home Demand Index
from prior month
from prior month
115
Home Demand Index
from prior year
from prior year
142
Months of
Inventory
Inventory
2.4
Average daily inventory last month
82
Inventory sold
last month
last month
34
Bright MLS | T3 Home Demand Index
www.homedemandindex.com
Baltimore | April 2024
Townhouse/Rowhouse/Twin All prices
Townhouse/
Rowhouse/Twin
All prices
The Index for townhouses rose 6 percent to 93 in March, moving from Slow to Steady demand. Buyer interest in this segment of the metro area market was marginally lower compared with one year earlier. The months supply, at 2.3, was down from 2.6 months in February.

Monthly Statistics for Townhouse/Rowhouse/TwinAll prices
Home Demand
Index
Index
93
(Steady)
Home Demand Index
from prior month
from prior month
88
Home Demand Index
from prior year
from prior year
94
Months of
Inventory
Inventory
2.3
Average daily inventory last month
2,033
Inventory sold
last month
last month
890
Bright MLS | T3 Home Demand Index
www.homedemandindex.com
Note
1. This report is generated with data from the following counties:
- Baltimore Metro – Anne Arundel, MD; Baltimore City, MD; Baltimore, MD; Carroll, MD; Harford, MD; Howard, MD;
- DelMar Coastal – Somerset, MD; Sussex, DE; Wicomico, MD; Worcester, MD;
- Maryland Eastern Shore – Caroline, MD; Cecil, MD; Dorchester, MD; Kent, MD; Queen Annes, MD; Talbot, MD;
2. This report is for the April 2024 period with data collected from the previous month.
Released: April 11, 2024
Reference ID: 2029
Baltimore | April 2024
Home Demand Map (Zip Codes)
Buyer interest in homes was Steady in Howard, Baltimore and Harford counties and Slow in the other metro area counties. The Index was higher in each metro area county compared with February. Demand was Moderate in the DelMar Coastal region and Steady in the Maryland Eastern Shore area. Across the Greater Baltimore area, demand in one-third of ZIP codes was High or Moderate, up from one-quarter of communities in February. Buyer interest in half of ZIP codes was in the Slow or Limited range in March, a decrease from 59 percent the previous month.

Bright MLS | T3 Home Demand Index
www.homedemandindex.com