The Bright MLS | T3 Home Demand Index rose to 137 in March, reflecting a High level of buyer demand for homes located in the Baltimore MLS market area. Compared with the previous month, demand rose by 25 percent. The latest reading was also 14 percent higher than the same month one year earlier.
Demand for all types of homes in the Baltimore market area rose in March, which is consistent with growing buyer interest in anticipation of the spring homebuying market. The largest increases, as well as the highest Index readings, were in the top tiers of the single-family and condo segments. Overall, however, demand was strong among most types of homes, except for lower-priced single-family which remained in the Limited category. Consistent with the past several months, the inventory of homes for sale was very lean ranging from just 0.7 months supply for mid-priced single-family homes to a three-month supply for higher-priced condos.
Monthly Statistics for April 2021
Home Demand Index
137
(High)
Home Demand Index from prior month
110
Home Demand Index from prior year
120
Index change from prior month
24.5%
Index change from same time last year
14.2%
Bright MLS | T3 Home Demand Index
www.homedemandindex.com
Download tile as an image.
Embed this tile on your site.
Baltimore | April 2021
Home Demand Index | Historical Year-over-Year Comparison
Demand for homes in the Baltimore market area rose for the third consecutive month in March and in fact, has been on an accelerating trend during the first months of 2021. Buyer interest is now approaching the seasonal highs recorded during the middle of last year, which was itself a period of elevated demand. Low inventory levels, an uptick in mortgage interest rates, and an improving economy have added a sense of urgency among would-be homebuyers leading to a flurry of activity as the spring buying season gets underway.
Home Demand Index
Bright MLS | T3 Home Demand Index
www.homedemandindex.com
Download the top-level Market Areas map as a screenshot.
Embed this tile on your site.
Baltimore | April 2021
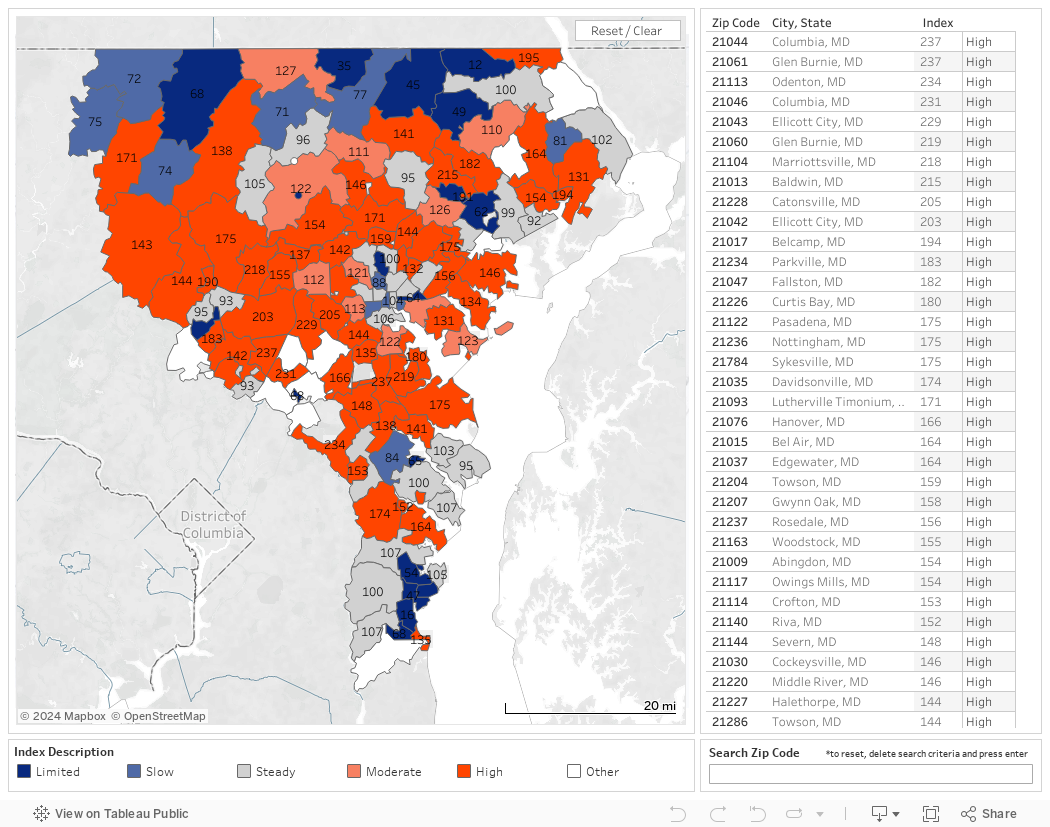
Home Demand Map
Across the Baltimore market area, nearly half of ZIP codes recorded a High level of market demand in March, nearly twice as many as in February. There were scattered areas of Steady demand in Baltimore City and the communities in and around Annapolis. Evidence of weaker demand was limited to 15 percent of ZIP codes, mostly located on the northern edge of the market area.
Bright MLS | T3 Home Demand Index
www.homedemandindex.com
Download tile as an image.
Embed this tile on your site.
Baltimore | April 2021
Demand and Inventory by Home Type
Demand for all types of homes in the Baltimore market area rose in March, which is consistent with growing buyer interest in anticipation of the spring homebuying market. The largest increases, as well as the highest Index readings, were in the top tiers of the single-family and condo segments. Overall, however, demand was strong among most types of homes, except for lower-priced single-family which remained in the Limited category. Consistent with the past several months, the inventory of homes for sale was very lean ranging from just 0.7 months supply for mid-priced single-family homes to a three-month supply for higher-priced condos.
Bright MLS | T3 Home Demand Index
www.homedemandindex.com
Download tile as an image.
Baltimore | April 2021
Single Family Home Below $250k
Buyer interest in lower-priced single-family homes rose 12 percent in March but remained in the Limited category. Despite the weak demand, homes that were listed were quickly sold. During the past several months, the inventory of homes available for sale has been unusually low even as the pace of sales has risen. The months supply of homes was just 0.9, a decline from the February reading of 1.1.
Monthly Statistics for Single Family Home Below $250k
Home Demand Index
67
(Limited)
Home Demand Index from prior month
60
Home Demand Index from prior year
109
Months of inventory
0.9
Average daily inventory last month
238
Inventory sold last month
253
Bright MLS | T3 Home Demand Index
www.homedemandindex.com
Download tile as an image.
Baltimore | April 2021
Single Family Home $250k - $590k
The Index for mid-priced single-family homes rose by 30 percent in March to 144, a reading in the High category. Like the overall Baltimore market, demand has risen each month in 2021 and was 19 percent higher than one year earlier. The number of homes for sale has not kept pace with sales resulting in a months supply of just 0.7, a decrease from February and the lowest of any type of Baltimore area home tracked by the Index.
Monthly Statistics for Single Family Home $250k - $590k
Home Demand Index
144
(High)
Home Demand Index from prior month
111
Home Demand Index from prior year
121
Months of Inventory
0.7
Average daily inventory last month
780
Inventory sold last month
1,098
Bright MLS | T3 Home Demand Index
www.homedemandindex.com
Download tile as an image.
Baltimore | April 2021
Single Family Home Above $590k
Among the single-family segments, demand for homes priced above $590,000 was the highest. The Index, with a reading of 225, was well above the threshold indicating a High level of buyer demand. Despite the relatively high price point, buyer interest increased by 40 percent during the month and was 48 percent higher than one year before. There was just a 1.6 months supply of homes for sale in March, a decline from the previous month that is consistent with the strong and rising interest would-be buyers in this segment have shown in recent months.
Monthly Statistics for Single Family Home Above $590k
Home Demand Index
225
(High)
Home Demand Index from prior month
161
Home Demand Index from prior year
152
Months of Inventory
1.6
Average daily inventory last month
476
Inventory sold last month
302
Bright MLS | T3 Home Demand Index
www.homedemandindex.com
Download tile as an image.
Baltimore | April 2021
Condo Below $310k
The Bright MLS | T3 Home Demand Index for lower-priced condos rose a modest 14 percent in March to a reading in the Moderate category. Consistent with other market segments, the months supply of condos for sale was low at 1.1 offering only marginally more home buying options compared with other similarly priced segments with even lower inventories of homes for sale.
Monthly Statistics for Condo Below $310k
Home Demand Index
124
(Moderate)
Home Demand Index from prior month
109
Home Demand Index from prior year
115
Months of Inventory
1.1
Average daily inventory last month
243
Inventory sold last month
222
Bright MLS | T3 Home Demand Index
www.homedemandindex.com
This is Tooltip!
Baltimore | April 2021
Condo Above $310k
Buyer interest in higher-priced condos rose 40 percent in March from an already elevated level of demand the previous month. The Index recorded a reading of 259, markedly higher than any other segment of the Baltimore market area and more than twice the level of one year earlier. For buyers searching for a condo priced above $310,000, a small segment of the overall market, inventory conditions were more favorable than other similarly priced segments. Even so, the inventory at three-months supply was down from 4.8 in February.
Monthly Statistics for Condo Above $310k
Home Demand Index
259
(High)
Home Demand Index from prior month
185
Home Demand Index from prior year
118
Months of Inventory
3
Average daily inventory last month
152
Inventory sold last month
51
Bright MLS | T3 Home Demand Index
www.homedemandindex.com
This is Tooltip!
Baltimore | April 2021
Townhouse/Rowhouse/Twin All prices
Townhouse/ Rowhouse/Twin All prices
The Bright MLS | T3 Home Demand Index for the townhouse segment rose 19 percent to a reading of 148 in March, reflecting a High level of buyer interest. The townhouse segment, comparable in sales transaction volume to the entire single-family segment, drives a significant portion of overall market activity in the region. In March, there was a one-month supply of townhouses for sale, a decline from 1.3 in February.
Monthly Statistics for Townhouse/Rowhouse/TwinAll prices
Home Demand Index
148
(High)
Home Demand Index from prior month
124
Home Demand Index from prior year
118
Months of Inventory
1
Average daily inventory last month
1,608
Inventory sold last month
1,549
Bright MLS | T3 Home Demand Index
www.homedemandindex.com
Note
1. This report is generated with data from the following counties: Anne Arundel, MD; Baltimore City, MD; Baltimore, MD; Carroll, MD; Harford, MD; Howard, MD
2. This report is for the April 2021 period with data collected from the previous month.
Released: April 12, 2021
Reference ID: 1159
Baltimore | April 2021
Home Demand Map (Zip Codes)
Across the Baltimore market area, nearly half of ZIP codes recorded a High level of market demand in March, nearly twice as many as in February. There were scattered areas of Steady demand in Baltimore City and the communities in and around Annapolis. Evidence of weaker demand was limited to 15 percent of ZIP codes, mostly located on the northern edge of the market area.
Bright MLS | T3 Home Demand Index
www.homedemandindex.com
Embed the Timeline
To embed the map on your website, copy and paste the code below. Please note that the ideal dimensions for displaying the map are 1312 pixels wide by 660 pixels high.
Embed the Map
To embed the map on your website, copy and paste the code below. Please note that the ideal dimensions for displaying the map are 1312 pixels wide by 1182 pixels high.
Embed the Housing Type Bar Chart
To embed the map on your website, copy and paste the code below. Please note that the ideal dimensions for displaying the map are 1312 pixels wide by 880 pixels high.