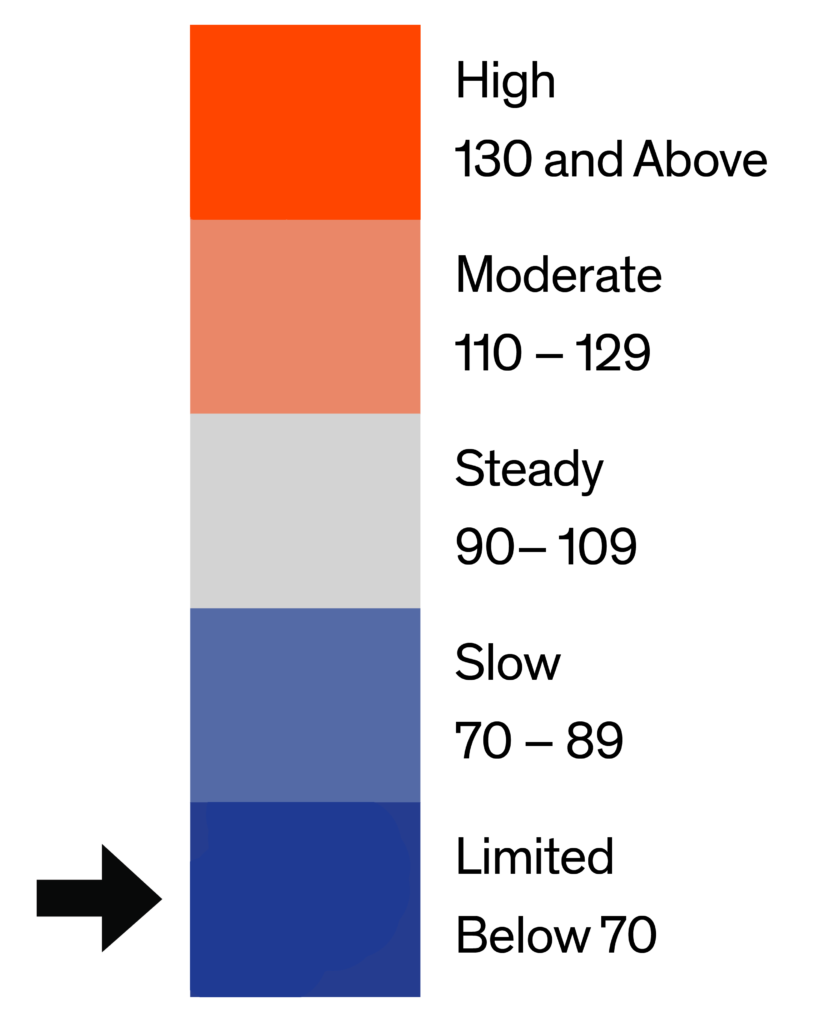
What is the Home Demand Index?

The Home Demand Index (HDI) is the nation’s only local housing market index that tracks pre-sale activity to measure housing market competitiveness. The HDI uses data on pre-sale activities, including in-person showings of homes and views of homes online, to measure housing market activity across different geographies and types of homes. The data used to construct the HDI are the most accurate and up-to-date information from the real estate agents and prospective buyers and sellers that are active in the market.

While most housing market indices are based on history, the HDI provides forward-looking insights to real estate professionals and consumers to help make better decisions in a rapidly changing real estate market
Embed this tile on your site (links update monthly).

Greater Metropolitan Market Areas

The Bright MLS |T3 Home Demand Index currently covers the three greater metropolitan market areas served by Bright MLS, namely the Greater Philadelphia Area (in blue), the Greater Washington D.C. Area (in gray), and the Greater Baltimore Area (in orange). Colors are provided for visual identification of each market area and do not correlate to index activity level. Make a selection on the map to go to the report for a market area or view an overview of each market area here..
Bright MLS | T3 Home Demand Index

www.homedemandindex.com

Washington D.C. | September 2025

Home Demand Index

The Home Demand Index (HDI) for the Washington D.C. metro area is at 85 in the latest report, down from 91 the previous month. The month-over-month decrease highlights a continued cooling trend, consistent with slower seasonal activity. However, the index remains above last year’s level of 81, indicating that buyer demand is still stronger than the same period a year ago. Overall, the market is categorized as Slow, with activity moderating yet maintaining a year-over-year edge.
Demand continues to soften across all home types in Washington D.C. for the third consecutive month, though levels remain higher than a year ago. The luxury single-family home segment experienced the largest decline, but it is still up compared to last year. Luxury condos also saw notable decreases, while entry-level single-family homes experienced the smallest decline, with a 4% drop from the previous month. Overall, demand is moderating in the short term but remains above last year across most segments, highlighting the ongoing impact of limited inventory on market dynamics.
Monthly Statistics for September 2025
Home Demand
Index
85
(Slow)
Home Demand Index
from prior month
91
Home Demand Index
from prior year
81
Index change
from prior month
-6.6%
Index change from
same time last year
4.9%
Bright MLS | T3 Home Demand Index

www.homedemandindex.com

Philadelphia | September 2025

Home Demand Index

The Home Demand Index (HDI) for the Philadelphia metro area declined to 77 in the current report, down from 85 last month and slightly below the 81 recorded during the same period last year. This continued month-over-month softening suggests a seasonal cooling in buyer activity as the market transitions from summer into early fall. The year-over-year dip, though modest, points to slightly weaker demand conditions compared to last September, indicating a cautious buyer environment.
Buyer demand across most home segments in Philadelphia declined this period, though levels remain above last year in several categories. The index for entry-level single-family homes edged down from 83 to 81 but stayed higher than the 77 recorded last year, reflecting sustained slow interest. Meanwhile, mid-range single-family homes experienced a sharper pullback, with the index falling to 72 from 80 and below last year’s 78, suggesting affordability pressures are beginning to weigh more heavily in this tier. While some segments remain resilient, the overall market is showing signs of cooling amid ongoing inventory constraints and seasonal transition.
Monthly Statistics for September 2025
Home Demand
Index
77
(Slow)
Home Demand Index
from prior month
85
Home Demand Index
from prior year
81
Index change
from prior month
-9.4%
Index change from
same time last year
-4.9%
Bright MLS | T3 Home Demand Index

www.homedemandindex.com

Baltimore | September 2025

Home Demand Index

The Home Demand Index (HDI) for the Baltimore metro area stands at 87 for this report period, marking a decline from 92 last month and equal to the 87 recorded a year ago. This latest reading keeps the region in the Slow demand category, though the month-over-month drop points to seasonal softening or growing affordability constraints. With year-over-year demand unchanged, the market appears stable but lacks upward momentum as buyers weigh affordability pressures against limited inventory.
Demand by home type in Baltimore has declined across all segments. Entry-level single-family homes posted a demand index of 69, down from 71 last month and 73 a year ago, indicating persistent affordability challenges and soft buyer engagement. Mid-range single-family homes fell to 87 from 94 last month but remain at the same level as last year 87, showing stable interest among move-up buyers. Luxury single-family homes dropped to 102 from 116 last month but remain well above last year’s 91, signaling continued demand from affluent buyers despite recent softening. Entry-level condos declined to 110 from 120 but remain above last year’s 105, reflecting steady demand. Luxury condos decreased slightly to 155 from 163 but continue to outperform the broader market. Townhouses fell to 89 from 92 and remain below last year’s 92, indicating moderate cooling in this segment.
Monthly Statistics for September 2025
Home Demand
Index
87
(Slow)
Home Demand Index
from prior month
92
Home Demand Index
from prior year
87
Index change
from prior month
-5.4%
Index change from
same time last year
0%
Bright MLS | T3 Home Demand Index

www.homedemandindex.com