October 2025 Report
Washington D.C. Metro
Washington D.C. | October 2025
Home Demand Index
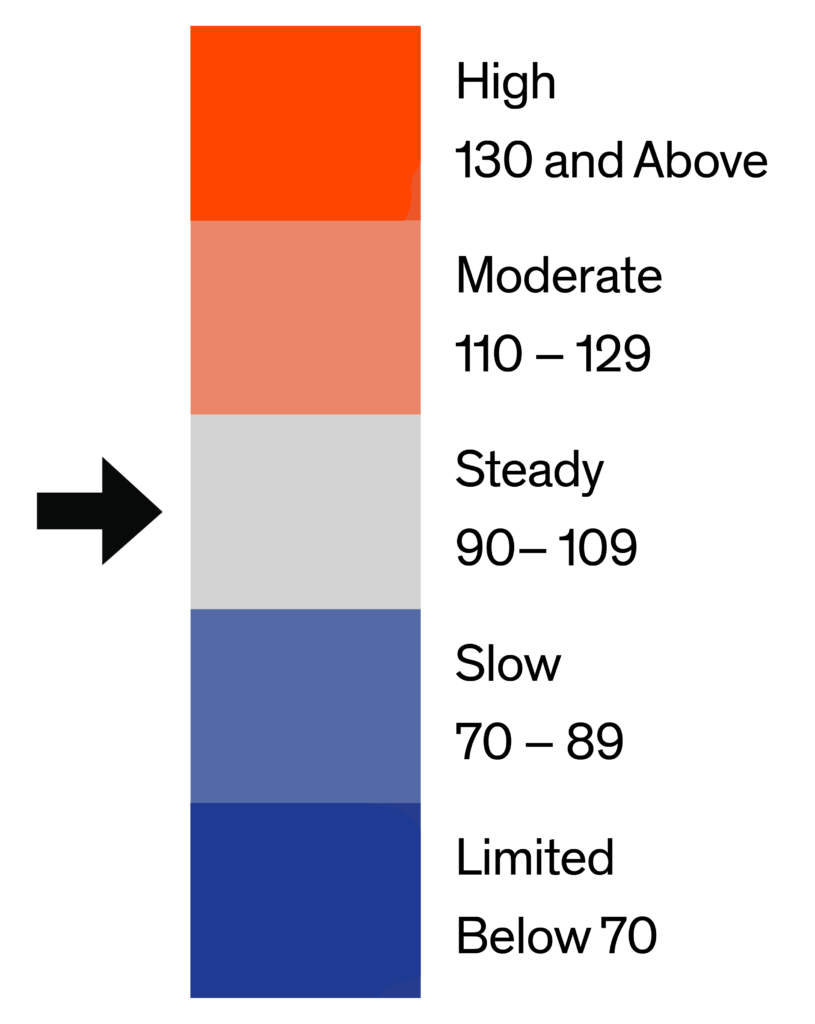
The Home Demand Index (HDI) for the Washington D.C. metro area is at 92 in the latest report, up from 88 last month. This month-over-month increase breaks a five-month streak of consecutive declines, suggesting a potential stabilization in buyer activity. Compared with last year’s index of 88, demand remains slightly stronger, reflecting a modest improvement over the same period. The market continues to be categorized as Steady, indicating balanced conditions after a period of slower activity.
Buyer demand in Washington D.C. is trending upward this month, with most home types showing growth. Luxury condos saw the largest gain, up 24% from last month, while luxury single-family homes rose 18%. Townhouses increased 6%, mid-range single-family homes grew 4%, and entry-level condos edged up 1%. Entry-level single-family homes remained flat. Overall, higher-end segments are seeing stronger demand, while entry-level markets remain steady, highlighting continued buyer interest amid seasonal shifts and limited inventory.

Monthly Statistics for October 2025
Home Demand
Index
Index
92
(Steady)
Home Demand Index
from prior month
from prior month
88
Home Demand Index
from prior year
from prior year
88
Index change
from prior month
from prior month
4.5%
Index change from
same time last year
same time last year
4.5%
Bright MLS | T3 Home Demand Index
www.homedemandindex.com
Washington D.C. | October 2025
Home Demand Index | Historical Year-over-Year Comparison
The Home Demand Index (HDI) for Washington D.C. rose to 92 this month, up from 88 in both last month’s report and the same period last year. This simultaneous month-over-month and year-over-year increase points to a moderate strengthening of buyer interest as the market enters the fall season. While not a dramatic shift, the improvement reflects renewed engagement in the housing market, particularly as buyers recalibrate expectations amid sustained inventory constraints and lingering affordability concerns.
Home Demand Index
Bright MLS | T3 Home Demand Index
www.homedemandindex.com
Washington D.C. | October 2025
Home Demand Map
Buyer demand continues to show geographic variation across the Washington D.C. metro region. Arlington County and Alexandria City remain at high demand, attracting strong buyer interest. Falls Church City has moved from slow to high demand, indicating increasing buyer focus in the area. Meanwhile, Fairfax County, Fairfax City, Loudoun County, and Washington, DC show steady demand, highlighting stable conditions in both suburban and urban markets. These trends underscore the differences in buyer preferences, with core areas maintaining high activity while other parts of the region continue at a consistent pace.
Bright MLS | T3 Home Demand Index
www.homedemandindex.com
Washington D.C. | October 2025
Demand and Inventory by Home Type
Buyer demand in Washington D.C. is trending upward this month, with most home types showing growth. Luxury condos saw the largest gain, up 24% from last month, while luxury single-family homes rose 18%. Townhouses increased 6%, mid-range single-family homes grew 4%, and entry-level condos edged up 1%. Entry-level single-family homes remained flat. Overall, higher-end segments are seeing stronger demand, while entry-level markets remain steady, highlighting continued buyer interest amid seasonal shifts and limited inventory.
Bright MLS | T3 Home Demand Index
www.homedemandindex.com
Washington D.C. | October 2025
Single Family Home Below $570k
The index for entry-level single-family homes in Washington, D.C. remained at 80 this month, unchanged from the previous month, and slightly below last year’s level of 82. The stable reading indicates that buyer demand continues to be slow, with activity remaining modest compared to the same period last year.

Monthly Statistics for Single Family Home Below $570k
Home Demand
Index
Index
80
(Slow)
Home Demand Index
from prior month
from prior month
80
Home Demand Index
from prior year
from prior year
82
Months of
inventory
inventory
3.3
Average daily inventory last month
1,267
Inventory sold
last month
last month
385
Bright MLS | T3 Home Demand Index
www.homedemandindex.com
Washington D.C. | October 2025
Single Family Home $570k - $1375k
The index for mid-range single-family homes in Washington, D.C. rose to 86 from 83 last month, remaining above last year’s level of 76. The month-over-month increase indicates a modest uptick in buyer interest, while the year-over-year gain shows that demand continues to outpace the same period in 2024. Overall, the market remains slow, reflecting cautious buyer behavior despite the positive momentum.

Monthly Statistics for Single Family Home $570k - $1375k
Home Demand
Index
Index
86
(Slow)
Home Demand Index
from prior month
from prior month
83
Home Demand Index
from prior year
from prior year
76
Months of
Inventory
Inventory
2.7
Average daily inventory last month
2,682
Inventory sold
last month
last month
976
Bright MLS | T3 Home Demand Index
www.homedemandindex.com
Washington D.C. | October 2025
Single Family Home Above $1375k
The index for luxury single-family homes in Washington, D.C. rose to 109 in the latest report, up from 92 last month, marking a notable rebound. The current level also surpasses last year’s 98, indicating stronger buyer demand compared to the same period in 2024. This increase reflects renewed activity in the luxury segment, suggesting that buyers are becoming more active after recent seasonal fluctuations.

Monthly Statistics for Single Family Home Above $1375k
Home Demand
Index
Index
109
(Steady)
Home Demand Index
from prior month
from prior month
92
Home Demand Index
from prior year
from prior year
98
Months of
Inventory
Inventory
4.1
Average daily inventory last month
932
Inventory sold
last month
last month
226
Bright MLS | T3 Home Demand Index
www.homedemandindex.com
Washington D.C. | October 2025
Condo Below $595k
The index for entry-level condos in Washington D.C. stands at 106 in the latest report, up slightly from 105 last month and unchanged from last year’s level of 106. This month-over-month increase reflects a modest rise in buyer activity, while the year-over-year stability indicates that overall demand remains consistent. The market continues to fall within the steady category, with entry-level condos maintaining a reliable appeal to buyers.

Monthly Statistics for Condo Below $595k
Home Demand
Index
Index
106
(Steady)
Home Demand Index
from prior month
from prior month
105
Home Demand Index
from prior year
from prior year
106
Months of
Inventory
Inventory
4.4
Average daily inventory last month
2,529
Inventory sold
last month
last month
581
Bright MLS | T3 Home Demand Index
www.homedemandindex.com
Washington D.C. | October 2025
Condo Above $595k
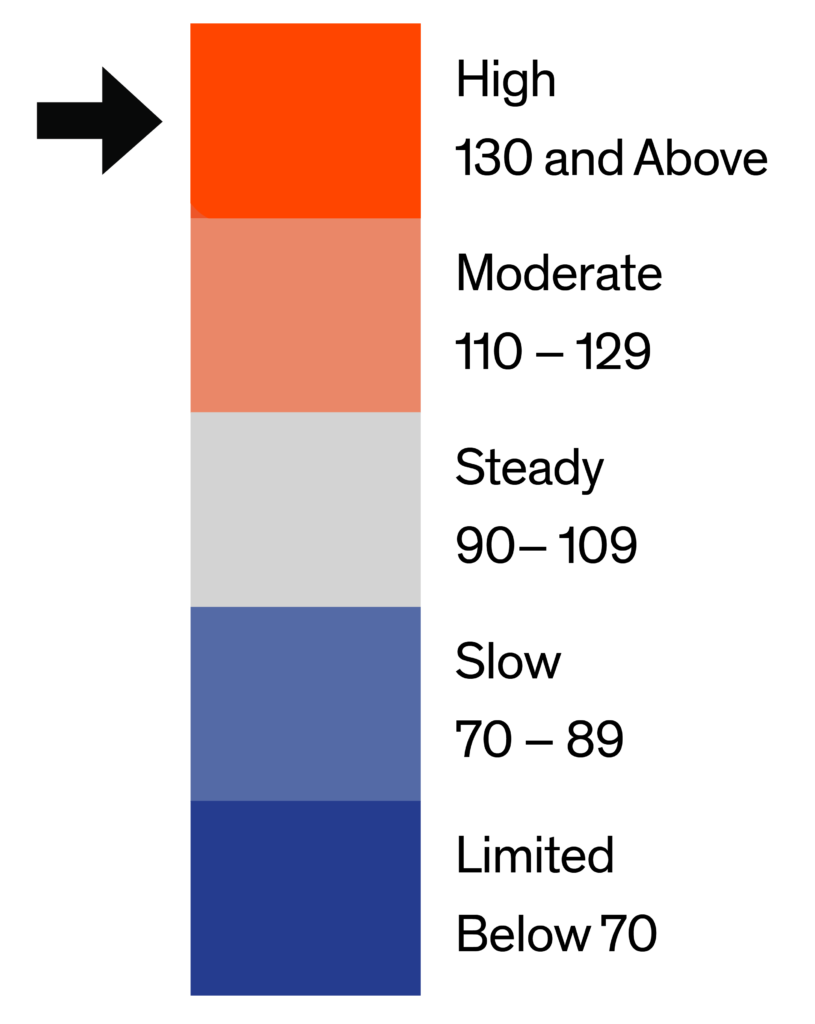
The index for luxury condos in Washington D.C. for this latest report is 139, up from 112 last month and above last year’s 128. The month-over-month increase signals a notable surge in buyer interest, moving the segment from steady to high activity. Compared to last year, demand has strengthened considerably, indicating a robust market for luxury condos at this time.

Monthly Statistics for Condo Above $595k
Home Demand
Index
Index
139
(High)
Home Demand Index
from prior month
from prior month
112
Home Demand Index
from prior year
from prior year
128
Months of
Inventory
Inventory
5.6
Average daily inventory last month
562
Inventory sold
last month
last month
101
Bright MLS | T3 Home Demand Index
www.homedemandindex.com
Washington D.C. | October 2025
Townhouse/Rowhouse/Twin All prices
Townhouse/
Rowhouse/Twin
All prices
The index for townhouses, rowhouses, and twins in Washington D.C. rose to 94, up from 89 last month and slightly above last year’s 90. The month-over-month increase indicates a rebound in buyer activity, while the year-over-year gain reflects sustained interest in this segment. With the index moving from Slow to Steady, the market shows stronger demand for buyers seeking affordable homes with additional space.

Monthly Statistics for Townhouse/Rowhouse/TwinAll prices
Home Demand
Index
Index
94
(Steady)
Home Demand Index
from prior month
from prior month
89
Home Demand Index
from prior year
from prior year
90
Months of
Inventory
Inventory
3.3
Average daily inventory last month
3,432
Inventory sold
last month
last month
1,048
Bright MLS | T3 Home Demand Index
www.homedemandindex.com
Note
1. This report is generated with data from the following counties:
- Maryland-West Virginia Panhandle – Allegany, MD; Berkeley, WV; Garrett, MD; Grant, WV; Hampshire, WV; Hardy, WV; Jefferson, WV; Mineral, WV; Morgan, WV; Pendleton, WV; Washington, MD;
- North Central Virginia – Caroline, VA; Clarke, VA; Culpeper, VA; Fauquier, VA; Frederick, VA; Fredericksburg City, VA; King George, VA; Madison, VA; Manassas City, VA; Orange, VA; Page, VA; Prince William, VA; Rappahannock, VA; Shenandoah, VA; Spotsylvania, VA; Stafford, VA; Warren, VA; Winchester City, VA;
- Southern Maryland – Calvert, MD; Charles, MD; Saint Marys, MD;
- Washington D.C. Metro – Alexandria City, VA; Arlington, VA; Fairfax, VA; Falls Church City, VA; Frederick, MD; Loudoun, VA; Montgomery, MD; Prince Georges, MD; Washington, DC;
2. This report is for the October 2025 period with data collected from the previous month.
Released: October 12, 2025
Reference ID: 2317
Washington D.C. | October 2025
Home Demand Map (Zip Codes)
Buyer demand continues to show geographic variation across the Washington D.C. metro region. Arlington County and Alexandria City remain at high demand, attracting strong buyer interest. Falls Church City has moved from slow to high demand, indicating increasing buyer focus in the area. Meanwhile, Fairfax County, Fairfax City, Loudoun County, and Washington, DC show steady demand, highlighting stable conditions in both suburban and urban markets. These trends underscore the differences in buyer preferences, with core areas maintaining high activity while other parts of the region continue at a consistent pace.

Bright MLS | T3 Home Demand Index
www.homedemandindex.com