October 2025 Report
Philadelphia Metro
Philadelphia | October 2025
Home Demand Index
The Home Demand Index (HDI) for the Philadelphia metro area stands at 82 in the current report, representing a slight increase from 79 last month but unchanged from the same period last year. This modest month-over-month uptick suggests a stabilizing trend in buyer activity, potentially reflecting the typical post-summer market rebalancing. While demand levels are not accelerating, they remain consistent with last year’s pace, indicating that the broader market is holding steady despite ongoing affordability pressures and inventory limitations.
Buyer demand across home types in Philadelphia shows mixed results this period. The index for entry-level single-family homes edged down slightly to 81 from 83 last month but remains above last year’s 81, indicating sustained though slow activity in the more affordable tier. Mid-range single-family homes recorded 74, down from 73 last month and just below last year’s 75, suggesting modest softening as affordability pressures temper move-up buyer activity. Luxury single-family homes rose to 68 from 58 but remain below last year’s 74, while entry-level condos climbed to 104 from 99, and luxury condos jumped to 121 from 104, both above last year. Townhouses increased slightly to 90 from 86, matching last year’s level. Overall, demand is steady but cautious, with stronger activity in condos and luxury segments.

Monthly Statistics for October 2025
Home Demand
Index
Index
82
(Slow)
Home Demand Index
from prior month
from prior month
79
Home Demand Index
from prior year
from prior year
82
Index change
from prior month
from prior month
3.8%
Index change from
same time last year
same time last year
0%
Bright MLS | T3 Home Demand Index
www.homedemandindex.com
Philadelphia | October 2025
Home Demand Index | Historical Year-over-Year Comparison
This month’s Home Demand Index (HDI) for Philadelphia is 82, up from 79 last month and equal to the 82 recorded during the same period last year. The steady year-over-year comparison highlights consistent buyer demand, suggesting that the market has maintained equilibrium despite broader economic headwinds. Over the past 12 months, HDI levels have fluctuated within a narrow range, signaling a stable housing market that continues to absorb seasonal and affordability-related pressures with limited volatility.
Home Demand Index
Bright MLS | T3 Home Demand Index
www.homedemandindex.com
Philadelphia | October 2025
Home Demand Map
Buyer demand across the Philadelphia metro remains uneven, with steady activity in core counties such as Bucks, Montgomery, Delaware, Chester, and New Castle. Philadelphia County continues to exhibit slower demand, reflecting affordability challenges and selective buyer behavior in higher-priced submarkets. Meanwhile, Kent County maintains moderate demand due to its accessibility and balanced inventory, while New Jersey counties and coastal areas such as Ocean County remain in the limited-demand range, highlighting ongoing caution among discretionary buyers.
Bright MLS | T3 Home Demand Index
www.homedemandindex.com
Philadelphia | October 2025
Demand and Inventory by Home Type
Buyer demand across home types in Philadelphia shows mixed results this period. The index for entry-level single-family homes edged down slightly to 81 from 83 last month but remains above last year’s 81, indicating sustained though slow activity in the more affordable tier. Mid-range single-family homes recorded 74, down from 73 last month and just below last year’s 75, suggesting modest softening as affordability pressures temper move-up buyer activity. Luxury single-family homes rose to 68 from 58 but remain below last year’s 74, while entry-level condos climbed to 104 from 99, and luxury condos jumped to 121 from 104, both above last year. Townhouses increased slightly to 90 from 86, matching last year’s level. Overall, demand is steady but cautious, with stronger activity in condos and luxury segments.
Bright MLS | T3 Home Demand Index
www.homedemandindex.com
Philadelphia | October 2025
Single Family Home Below $357k
The index for entry-level single-family homes in Philadelphia is at 81 this month, down slightly from 83 in the previous report and unchanged from the same period last year. This minor month-over-month dip signals a marginal softening in buyer activity, though demand remains consistent year-over-year. Overall, this segment continues to reflect steady but subdued interest, likely limited by ongoing affordability constraints and tight inventory.

Monthly Statistics for Single Family Home Below $357k
Home Demand
Index
Index
81
(Slow)
Home Demand Index
from prior month
from prior month
83
Home Demand Index
from prior year
from prior year
81
Months of
inventory
inventory
2.3
Average daily inventory last month
1,369
Inventory sold
last month
last month
586
Bright MLS | T3 Home Demand Index
www.homedemandindex.com
Philadelphia | October 2025
Single Family Home $357k - $795k
The index for mid-range single-family homes in Philadelphia increased modestly to 74, up from 73 last month but slightly below last year’s level of 75. This small month-over-month rise suggests a stabilizing trend in buyer demand, even as year-over-year comparisons indicate minimal change. The market for mid-range homes appears relatively steady, with buyers maintaining consistent engagement despite affordability and supply-side pressures.

Monthly Statistics for Single Family Home $357k - $795k
Home Demand
Index
Index
74
(Slow)
Home Demand Index
from prior month
from prior month
73
Home Demand Index
from prior year
from prior year
75
Months of
Inventory
Inventory
2.1
Average daily inventory last month
3,432
Inventory sold
last month
last month
1,600
Bright MLS | T3 Home Demand Index
www.homedemandindex.com
Philadelphia | October 2025
Single Family Home Above $795k
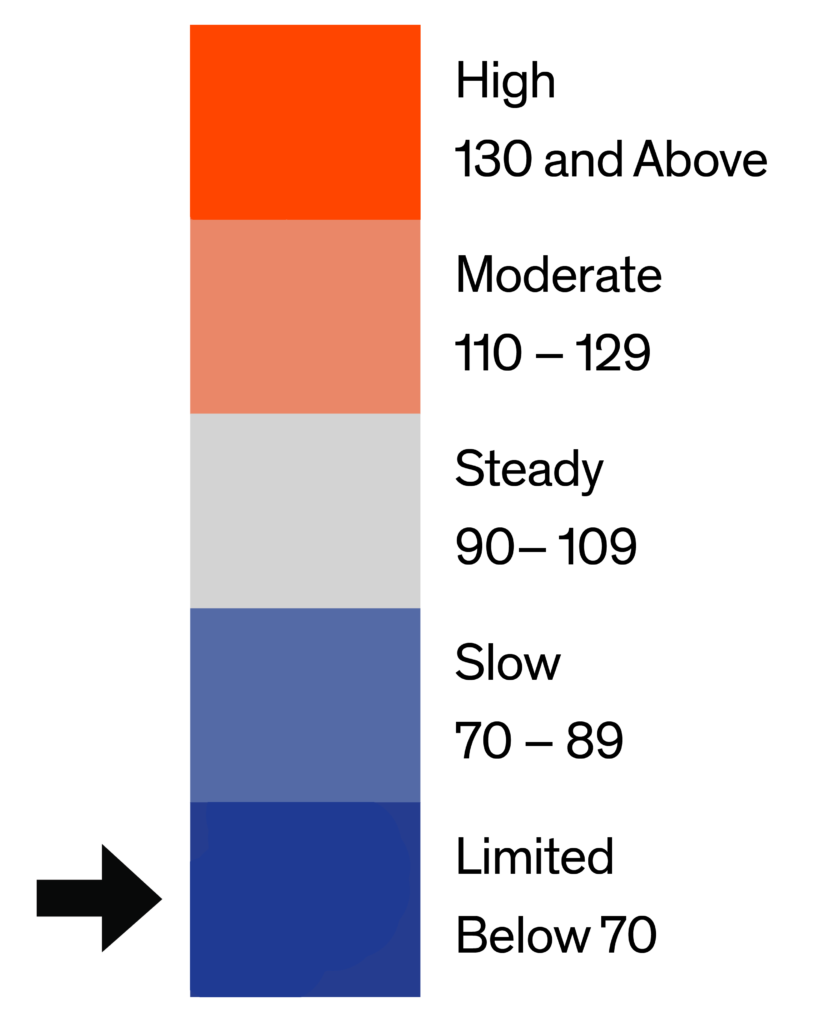
The index for luxury single-family homes in Philadelphia rose to 68 in the latest report, up from 58 last month but still below last year’s reading of 74. The month-over-month increase reflects a short-term rebound in buyer interest, though demand remains softer than it was a year ago. This suggests the high-end segment is seeing some renewed activity, but broader economic headwinds may still be tempering momentum in the luxury market.

Monthly Statistics for Single Family Home Above $795k
Home Demand
Index
Index
68
(Limited)
Home Demand Index
from prior month
from prior month
58
Home Demand Index
from prior year
from prior year
74
Months of
Inventory
Inventory
3.1
Average daily inventory last month
1,251
Inventory sold
last month
last month
407
Bright MLS | T3 Home Demand Index
www.homedemandindex.com
Philadelphia | October 2025
Condo Below $425k
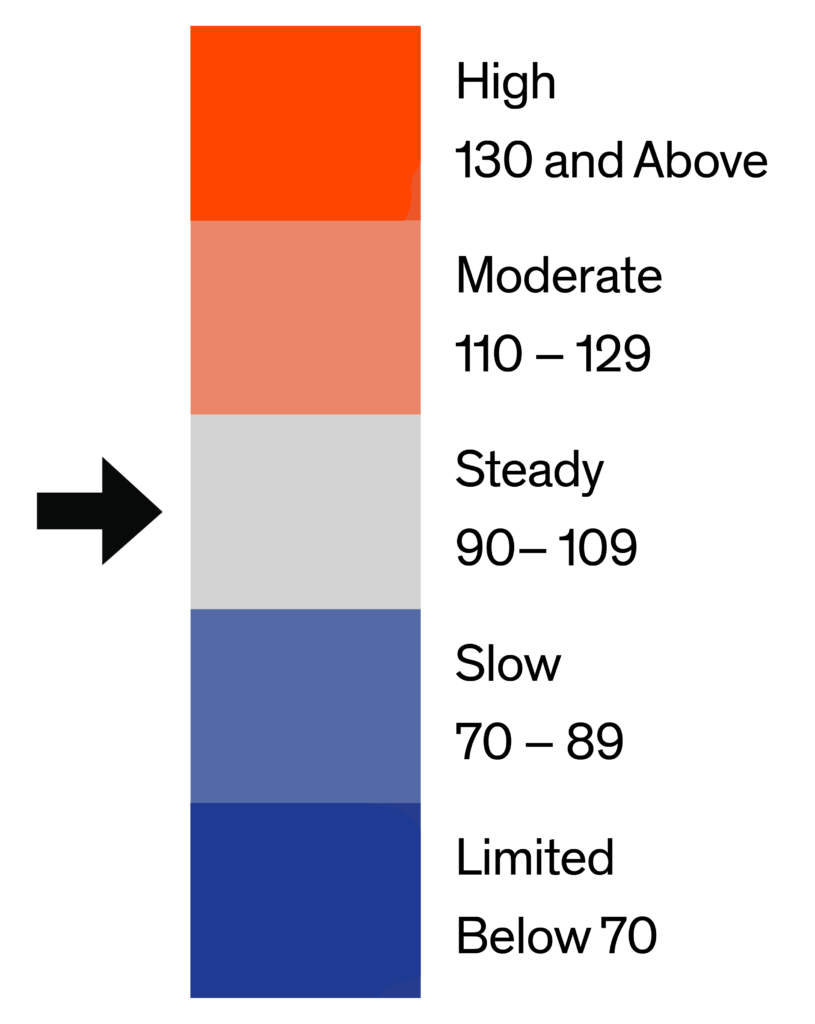
The index for entry-level condos in Philadelphia rose to 104 this month, up from 99 in the previous report and 93 a year ago. This increase signals growing buyer interest in the more affordable end of the condo market, driven by ongoing affordability challenges in other home segments. The upward trend reflects steady demand and positions this segment as a continued point of strength in the broader market.

Monthly Statistics for Condo Below $425k
Home Demand
Index
Index
104
(Steady)
Home Demand Index
from prior month
from prior month
99
Home Demand Index
from prior year
from prior year
93
Months of
Inventory
Inventory
3.9
Average daily inventory last month
1,046
Inventory sold
last month
last month
267
Bright MLS | T3 Home Demand Index
www.homedemandindex.com
Philadelphia | October 2025
Condo Above $425k
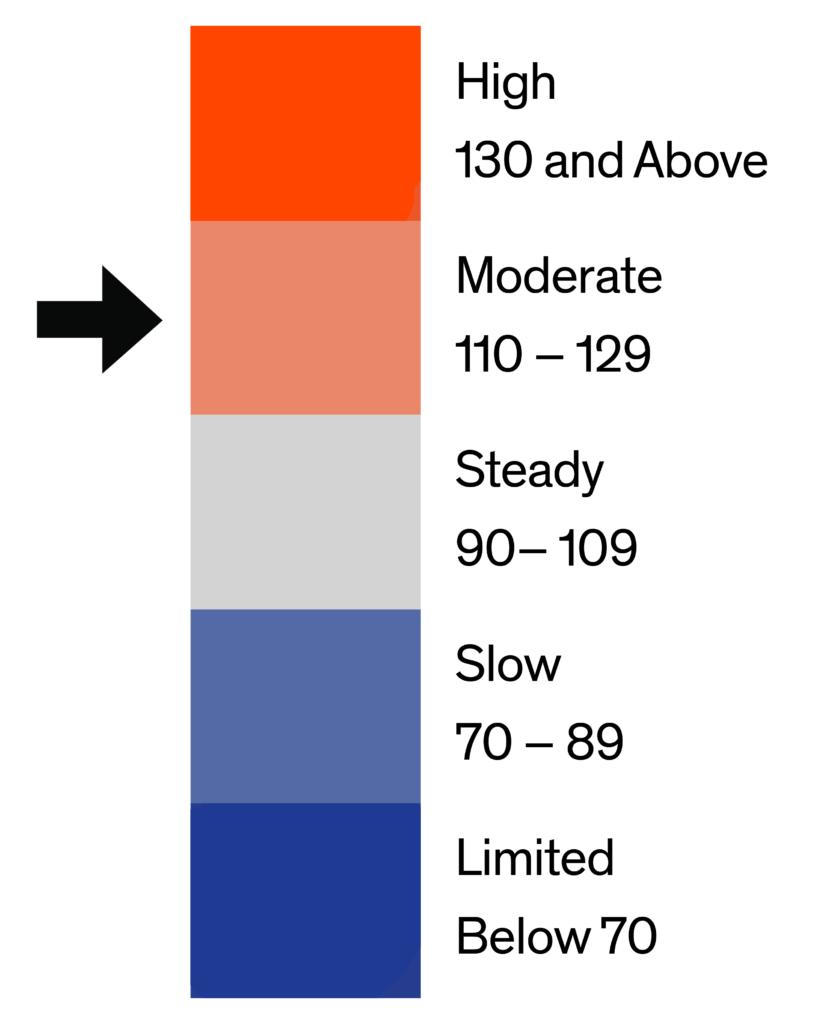
The index for luxury condos in Philadelphia climbed to 121 this month, a notable rise from 104 last month and up from 98 a year ago. The strong month-over-month and year-over-year gains suggest renewed enthusiasm in the high-end condo segment, possibly driven by increased availability or favorable pricing. This rebound indicates that buyer confidence in the luxury condo market has improved, reversing previous softness observed earlier in the year.

Monthly Statistics for Condo Above $425k
Home Demand
Index
Index
121
(Moderate)
Home Demand Index
from prior month
from prior month
104
Home Demand Index
from prior year
from prior year
98
Months of
Inventory
Inventory
5.9
Average daily inventory last month
308
Inventory sold
last month
last month
52
Bright MLS | T3 Home Demand Index
www.homedemandindex.com
Philadelphia | October 2025
Townhouse/Rowhouse/Twin All prices
Townhouse/
Rowhouse/Twin
All prices
The index for townhouses, rowhouses, and twins in Philadelphia stands at 90, up from 86 last month and matching the level recorded during the same period last year. This stable year-over-year performance, coupled with modest month-over-month growth, points to consistent buyer interest in this segment. The attached home market continues to offer a balanced option for buyers seeking space and relative affordability within a constrained inventory environment.

Monthly Statistics for Townhouse/Rowhouse/TwinAll prices
Home Demand
Index
Index
90
(Steady)
Home Demand Index
from prior month
from prior month
86
Home Demand Index
from prior year
from prior year
90
Months of
Inventory
Inventory
3.5
Average daily inventory last month
6,739
Inventory sold
last month
last month
1,923
Bright MLS | T3 Home Demand Index
www.homedemandindex.com
Note
1. This report is generated with data from the following counties:
- Central Pennsylvania – Adams, PA; Berks, PA; Cumberland, PA; Dauphin, PA; Franklin, PA; Fulton, PA; Lancaster, PA; Lebanon, PA; Perry, PA; Schuylkill, PA; York, PA;
- Ocean County – Ocean, NJ;
- Philadelphia Metro – Bucks, PA; Burlington, NJ; Camden, NJ; Chester, PA; Delaware, PA; Gloucester, NJ; Kent, DE; Mercer, NJ; Montgomery, PA; New Castle, DE; Philadelphia, PA;
- Salem-Cumberland – Cumberland, NJ; Salem, NJ;
2. This report is for the October 2025 period with data collected from the previous month.
Released: October 12, 2025
Reference ID: 2316
Philadelphia | October 2025
Home Demand Map (Zip Codes)
Buyer demand across the Philadelphia metro remains uneven, with steady activity in core counties such as Bucks, Montgomery, Delaware, Chester, and New Castle. Philadelphia County continues to exhibit slower demand, reflecting affordability challenges and selective buyer behavior in higher-priced submarkets. Meanwhile, Kent County maintains moderate demand due to its accessibility and balanced inventory, while New Jersey counties and coastal areas such as Ocean County remain in the limited-demand range, highlighting ongoing caution among discretionary buyers.

Bright MLS | T3 Home Demand Index
www.homedemandindex.com